

Introduction
Material and Methodology
Target Region
Qualitative Analysis of Case Study
Numerical Modeling
Experimental Measurements
ENVI-met Configuration
Results and Discussion
Microclimate Parameters Analysis
Mean Radiant Temperature Variation Analysis
Outdoor Thermal Comfort Perception
Conclusion Remarks
Introduction
Morocco is classified as a very vulnerable country in the Fourth Assessment Report of the United Nations Intergovernmental Panel on Climate Change (IPCC). The effects of climate change are becoming increasingly visible, with drought, heat waves, and an increase in average temperatures affecting Moroccan regions [1]. An increase of 1°C has been detected across the country, with estimates indicating an increase of 1 to 1.5°C till 2050 (3rd NC Morocco 2016).
Vegetation is a natural solution for urban cooling. In general, more greening will have a more significant cooling effect on the city [2, 3, 4]. As one of the most essential elements of urban ecosystems, it can help mitigate urban heat islands by regulating microclimate, providing thermal comfort, reducing energy consumption and weakening the impact of greenhouse gases [5].
Different configurations for urban vegetation have been implemented and evaluated, and several rates and types of vegetation have been tested in the literature [6]. Some studies assess different arrangements of urban vegetation areas [2], while others focus on roof and wall greening, with or without watering [7, 8, 9]. In Paris, the MUSCADE project has shown that the increase in vegetated ground cover has a more effective cooling power than vegetated roofs, especially since the rate of vegetation and the proportion of trees are essential. On the other hand, green roofs are the most efficient approach to cutting energy use year-round and during the summer, primarily due to their ability to act as insulators [10]. The study conducted in Lucknow city in India using remote sensing tools emphasizes the importance of vegetation in moderating Urban Heat Island impacts. It explored the relationship between land use and land cover and the increase in land surface temperature [11]. Yu and Hein have studied the influence an urban park could have on its environment. It showed that the reduction in temperatures generated by the park reduced air conditioning loads as we approached it. Buildings 100 m from the garden have 9% lower air conditioning requirements than buildings 400 m away [12].
Four types of vegetation areas are present in Moroccan cities: urban forests, parks, private gardens and street trees, and urban agriculture areas. Several cities still house farms like Fes, Meknes, Marrakech, and Rabat…, for instance, in Meknes, three valleys with an area of about 1520 ha, bisect the agglomeration (Oued Boufekrane, Oued Ouislane, and Oued Bouishak). However, it faces extinction because of inaccessibility, pollution, marginalisation and insecurity [13]. The sixth IPCC report regularly mentions urban agriculture (UA) as a tool for food security and a way to reduce CO2 emissions in the production and transportation of our food. A third of the world’s anthropogenic greenhouse gas emissions are attributed to the food system [14]. Morocco has voluntary emission reduction commitments as part of its National Plan Against Climate Change 2019. Adaption measures for urban areas are still lacking in many aspects. Land use management as a tool to mitigate climate change, particularly in metropolitan areas, has received little attention. It is critical to preserve intra-urban green valleys, which serve as the main lungs and green areas of urban agglomeration [15]. This paper deals with the assessment of the cooling potential of different green spaces in the urban context, notably the UA zones, on outdoor thermal comfort. No studies have ever focused on the impact of UA to improve the microclimate and mitigate urban heat island effects in Morocco.
An important debate is currently underway on urban planning codes and practices. The last urban development plan incorporated new approaches and sustainability measures [16]. However, more attention should be paid to preserving these spaces rather than replacing them with buildings.
Material and Methodology
The four types of vegetated areas generally present in the cities of Morocco are analysed. Urban forest with dense and high trees, public garden characterized by scattered trees and alternation of grass and mineralized areas and urban agricultural space vegetated and irrigated in winter and with natural soil and some low plants (pasture and arable farmland) in summer. All patterns are chosen from Rabat and are simulated during a summer typical hot day. They were first subjected to a qualitative analysis based on five indicators to characterise vegetation’s density, type and distribution. Subsequently, an experimental campaign is done to validate the 3D numerical model ENVI-met in two areas of the selected regions. The choice of this predictive model is justified by its several advantages. It considers vegetation more than a physical object, it is a biological component of the urban environment that impacts the energy balance by exchanging vapour and heat, and it allows the introduction and definition of new plants in addition to plants predefined in its databases. Air temperature (Ta), relative humidity (HR), surface temperature (Ts), wind speed (Ws), and Mean Radiant Temperature (MRT) were compared, in addition to the comfort index Predicted Mean Vote (PMV) which allows for assessing the potential of different urban vegetation areas to improve external thermal comfort.
Target Region
The city of Rabat has a considerable potential for wealth, characterised by diverse geography and various landscapes [17]. Rabat is located in the Atlantic Coastal zone from Safi to Tangier. It has a temperate climate and the maximum temperature range between 30°C and 38°C, and the soils are relatively fertile. Moreover, the primary plantation type is Quercus Robur, Pine plantations, Pine Canariensis, Pine halepensis, and Eucalyptus [18].
Four samples are chosen in Rabat city: Ibn Sina Forest (ZA), Hassan II Park (ZB) and a part of Bouregrag Valley (ZC), and the baseline case is a built area with a high ratio of vegetation and pervious surface (49.69%). It is a part of district Souissi, composed of individual villas with private gardens (ZD). Figure 1 shows the positions of each studied sample.

Qualitative Analysis of Case Study
A qualitative analysis of different studied cases is done based on some morphological indicators. Five morphological indicators are calculated to characterise the four landscape patterns; the data are from the fieldwork, the Geoportal of Urban Agency of Rabat and Sale (AURS) and ENVI-met output.
Table 1 summarises different values. Sky View Factor (SVF) provide an idea about the opening at each point of the vegetation zone. It is higher for ZC because of the absence of elevated structures. ZD is about 0.7 due to the low density and height of the buildings, and it is 0.42 for ZA and 0.49 for ZB, indicating the high areal density and size of trees. Values of roughness confirm this remark. The pervious and impervious percentages indicate the land use. The substitute for previous surfaces by artificial impervious ones impacts radiative and water balance by reducing vegetation evapotranspiration. The surface heat flux distribution differs distinctly in intensity and magnitude according to surface characteristics and the sky-view factor. The areas with higher sky-view factor and lower vegetation cover-abundance record the most increased sensible heat flux and higher land surface temperature [19]. A surface with a low albedo absorbs most of the radiation and reflects only a tiny amount. The albedo of trees is between 0.15 and 0.19. In contrast, a high albedo means that a surface absorbs a small quantity of the incoming radiation and reflects the remainder. It ranges between 0.5 and 0.95 for materials composing the built zones. The albedo of urban materials is generally lower than those containing the countryside or UA zone [20].
Table 1.
Morphological indicators for different studied areas
Numerical Modeling
ENVI-met schematises plants as a 1D column with height zp and a root depth zr. It is divided into ten equidistant nodes above the ground and in the root part. The leaf area density (LAD) and the root area density (RAD) are defined for each layer.
Turbulent fluxes of heat and vapour
The eq. (1)eq. (2) and eq. (3)gives the direct heat flux Jh, transpiration flux Jtrans, and evaporation flux Jevap.:
Where is the foliage temperature, is the temperature of the air around the leaf, and factor 1.1 accounts for that part of the biomass that exchanges heat without transpiring.
is the humidity difference between the leaf and air: with q* is the saturation value of q at the leaf surface, and qa is the specific humidity of the air around the leaf.
defines whether evaporation and transpiration are possible ( is set to 1 if or 0 if only condensation is likely). Considering that only the vegetation’s wet areas can vaporise, see eq. (2) on the other side, only dry parts will transpire see eq. (3) the fraction of wet leaves inside one grid cell is needed. fw is the fraction of wet leaves and can be calculated as eq. (4):
where Wdew is the amount of dew on the leave surfaces and Wdew, max is the maximum possible value 0.2 [kg/m2].
the aerodynamic resistance of the leaf. It is a function of the leaf diameter and the wind speed at the leaf surface [21]:
A is 87 [s 0.5 /m] for conifers and 200 [s 0.5 /m] for grass and deciduous trees. D is the average diameter of the leaf.
rs is the stomatal resistance measuring the degree to which the stomata are opened tiny openings regulating the exchange of gases between leaf and air]. The A-gs model is based on the photosynthesis rate An and the plant’s stomatal conductance gs [mm/s] to calculate its evapotranspiration [22]. The introductory relation of the model can be added up as eq. (5) :
Cs and Ci are the CO2 concentration at the surface and, respectively, inside the leaf, and the relation between resistance and conductance is eq. (6) :
The minimal stomatal resistance rs min varies by plant type and ranges from 200 [s 0.5 /m] for grass to 400 [s 0.5 /m] for deciduous leaves.
Energy balance of the leaf
The leaf energy budget can be expressed by eq. (7) :
Cp denotes the specific heat of air, while L denotes the latent heat of vaporisation. The foliage temperature can be obtained from the steady-state leaf energy budget if the internal energy storage inside the leaf is neglected ().
Rswnet and R_Lwnet are the net shortwave and the net longwave radiation absorbed by the leaf surface. R_Lwnet is expressed by the eq. (8)
F is a non-dimensional parameter describing the orientation of the leaves towards the sun (=0.5 for randomly orientated leaves), σf is the albedo of the foliage, and trf is a transmission factor (set to 0.3).
Tf obtained by solving the steady-state leaf energy budget can be used for computing the eq. (1), (2) and (3).
Qh and Qr, the heat and vapour exchanges between air and vegetation in the atmospheric model are then expressed by eq. (9) and eq. (10) :
Furthermore, the soil model is also coupled with a vegetation model and the ground and building surfaces balance calculation.
ENVI-met provides a Database summarising physiological parameters needed for the simulation for all vegetation types ranging between grass and tall trees, the stomata resistance, the nature of the plant (deciduous or conifers), and the albedo of the foliage. This base is expandable by the users.
Water balance of the plant
There is a feedback mechanism between water transpiration by the plant and water supply by the soil. The water transpired by the plant must be taken from the ground via root water uptake, resulting in a loss of soil water content. If the soil fails to supply enough water, the stomatal resistance will increase, and the transpiration rate will decrease.
The total mass of water (mtrans) transpired by the plant is given by the vertical integral over the transpiration fluxes in the different plant layers eq. (11) :
The water is taken from different soil layers inside the plant’s root zone depending on the number of roots in the layer RAD(z) value and the hydraulic diffusivity of the soil layer as eq. (12):
Experimental Measurements
The assessment of the accuracy of the numerical model has been mentioned in several studies [23, 24]. Despite initially being developed for temperate climates, the model has been successfully validated in several climate conditions, including Morocco’s [25]. To validate the numerical model in the environment of Rabat, Ouali simulated three street canyons from different local climate zones of the city [26]. The experimental measurements campaign was conducted 24 hours on three days in July 2022. The comparison shows sufficient accuracy of the predictive model of the urban microclimate in Rabat [26]. The study of Li and Song found that for vegetated zones, simulated ENVI-met results were similar to observed data, with an index of agreement of 0.69-0.88 [22].
A street canyon is selected from ZD and ZB. The results of the simulation are then compared to those of the experiment campaign to validate the microclimatic 3D model. The measurements were carried out using weather station PCE-FWS-20 installed respectively on the two positions (see Figure 2) on July 6th, 2022. Air temperature is continuously recorded in the centre of each zone with the station installed at 1.4 m high. Simulation results analysis is also done for the same height. Table 2 tabulates different parameters for the model configuration.

Comparison between measured and simulated values is based on the coefficient of determination (R2) and the Root Mean Square Error (RMSE), defined as eq. (13):
ENVI-met Configuration
ENVI-met was run for 24h on July 9th, 2022 a typical summer day with low temperatures of 22°C and high temperatures of 27°C, high humidity, no precipitation, and no cloud cover (see Table 2). July is the heat stressful period based on the temperature data between 2000 and 2016, recorded by the metrological weather station of Rabat Sale. The materials properties of walls, roofs, and roads for ZD and the pedestrian’s walkways for ZB required for ENVI-met configuration are the same used for the model validation (Table 2).
Table 2.
Materials properties and general conditions for simulations
The table below summarises the characteristics and distribution of identified trees in all the studied zones (see Table 3). LAD characterises the vertical foliage structure, defined for each horizontal layer. The LAD is the portion of the leaf surface [m²] within a volume of air [m3], and RAD is the same parameter for roots. In ENVI-met, like in most other models, the LAD is counted one-sided, meaning only one side of the leaf counts as active surface area.
Table 3.
Characteristics and quantity of vegetation present in the simulated sites
The requirement parameters input to add a 3D plant in the ENVI-met plants database are the type of the plant according to CO2 fixation: a deciduous, a conifers or a grass, minimum stomata resistance of the plant, the short-wave albedo of the leaf, LAD and RAD for 10 data points and name of the plant [21]. The simulated areas include several species of tree. Some of them are defined in the 3D plant database of ENVI-met, and others are introduced. The table below summarises different data (see Table 3). The 2D and 3D input areas are established based on the Geoportal of AURS [27] and fieldwork, visits, photos and measurements (see Figure 3).

Results and Discussion
The level of uncertainty for the ENVI-met 4.4.2 model, represented by the RMSE in %, is 0.97 (3% of the air temperature average value in ZD) and 0.98 (4% for ZB). The significantly higher R² values confirmed that the model best matches the experimental data. (see Figure 4). Consequently, the predictive model can provide simulation results with sufficient accuracy in the climate of Rabat and in-built and vegetated zones.

Microclimate Parameters Analysis
The comparison shows that even with a vegetation percentage of almost 50%, the half-built scenario shows temperatures much higher than the fully vegetated areas. This difference is maximum at 7 h, and it reaches 3.5°C. The results prove that the insertion of vegetation in urbanised areas in the form of a private garden or tree alignment in the main streets cannot compensate for the advection cooling effect that can create a sizeable vegetated area such as an urban forest, a public park or even a preserved UA area in the centre or on the outskirts of the city (see Figure 5). This result coincide with the review of 85 papers on the optimal vegetation configuration for urban heat mitigation proved that large green spaces improve the refreshment ability effectively [28]. At 17 h, the UA zone records a 2 m air temperature higher by about 0.8°C than the public park scenario and 1.6°C than the forest one. This is because zone ZC is simulated during a summer period. After the harvest, there is a quantity of vegetation which is less and which is dispersed, and the soil is not irrigated during this period. The results must be comparable to those obtained by ZA for agricultural zones with fruit trees or olive trees. The results show that the surface temperature is higher for the half-built area because the mineralised ground absorbs direct and reflected radiation more than natural soil, affecting the radiation balance. The shading effect of buildings is insufficient to compensate for this change and the radiative trapping phenomenon. In contrast, shading of trees and evapotranspiration effects are noticeable for the three vegetated zones.

The surface temperature for the UA zone is higher than the forest (dense tree) and public garden (scattered tree) by day. However, by night, ZD is cooler than ZA and ZB because of the natural ventilation, which is more favoured by the absence of obstacles. During the morning, ZC records higher surface temperatures than ZA and ZB, but after 12h, it becomes the weakest of all the scenarios. This is mainly due to the significant natural ventilation and the heat stored in ZA, ZB and ZD caused by the obstacles, whether trees or built structures (see Figure 5). One of the most critical factors affecting pedestrian comfort in spaces outside is the wind and its turbulent character. At 2 m above ground, the height is considered a reference for thermal comfort studies. The wind speed is much higher for ZC and ZB than in the other scenarios. Figure 5 shows that the recorded wind speed remains acceptable for all scenarios studied, knowing that the dynamic effects of the wind modify the individual’s behaviour and hinder his movements from a rate greater than 5 m/s [29]. The relative humidity at Figure 5 is lower between 4h and 10h in the half-built scenario ZD than in the vegetated ones but higher during the remainder of the day. It is due to the sub-humid climate of Rabat and the evapotranspiration of plants and buildings, which represent obstacles to natural ventilation and the dissipation of the water vapour. Contrary to the public garden and the UA zones which have the same curves and recorded the minimum relative humidity values except between 6h and 10h.
Mean Radiant Temperature Variation Analysis
The first observation from Figure 6(a) is that the dense tree zones provide a cooling potential more than parks, gardens or low plant areas by about 30°C in terms of MRT. Having forests like Ibn Sina Urban Forest or the Green Belt in Rabat can significantly enhance the adjoining built zones’ microclimate. The UA zone registered an MRT value between 14.0°C at 8h and 53.5°C at 17h, representing a high value of MRT but still lower than the built zone ZD with a vegetation ratio of 49% and comparable to the fluctuating ZB. The refreshment potential is defined for the three vegetated cases ZA, ZB and ZC compared to the base case ZD. Figure 6(b) shows that ZA is the best scenario. ZC represents a higher refresh potential than ZB, considering the number of hours when the refreshment potential is higher for ZC than ZB.

The analysis of the results for the four microclimatic parameters, namely air temperature at 2 m height, surface temperature, relative humidity, and wind speed, is not sufficient to conclude about the thermal benefits of ZC. The mean radiant temperature is a determinant parameter in the level of thermal comfort [30]. It reveals that the ZC scenario represents values that are more favourable than ZD, worse than ZA, and equivalent to ZB. For greater precision, a thermal comfort index involving other parameters particular to human perception of comfort and the concept of self-regulation of human body temperature and physical activity intensity would be required.
Outdoor Thermal Comfort Perception
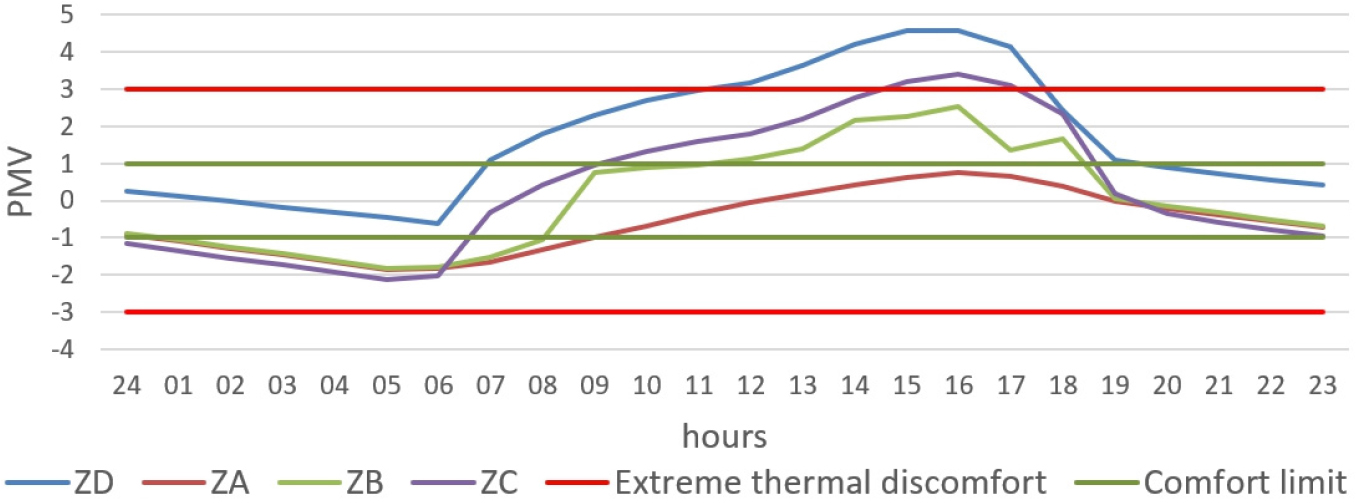
PMV is chosen as the thermal comfort index to evaluate the impact of vegetation in different studied cases. Fanger originally developed PMV for steady-state indoor situations [27]. It is also used as ISO 7730 [28]. The universal applicability of the PMV model has been argued for a long time [29]. In 1981, Jendritzky and Nübler developed a quantitative model based on an adaptation of Fanger’s comfort PMV equation to outdoor conditions [30] by adding complex outdoor radiation (solar and longwave radiation) and allowing wind speeds above an indoor room situation to the energy flux related parts of the model, PMV can also be applied -with limits- to outdoor conditions. The developed model combines the majority of microclimatic analysis factors. It uses the average value of the votes of a large group of people. Thermal sensation level is evaluated using the 7 limits: − 3 very cold, − 2 cold, − 1 slightly cold, 0 neither hot nor cold, +1 slightly warm, +2 hot, +3 very hot [27]. The PMV expresses the variance from -3 to +3 from a balanced human heat budget and Perceived Temp, the temperature of a regulated environment which achieves the same PMV as the natural environment. Clothing and activity are considered variables.
Figure 7 shows some differences between the four studied zones. By night, from midnight to 6 h, the PMV ranges between -2 and -1 for the three vegetated zones and around 0 for the half-built zone. The nocturnal comfort is related to the ambient climate more than the composition of the urban area. The daily difference in PMV values between half-built and vegetated zones provides information regarding heat retention in the city’s mineralised materials. The solar energy absorbed by the building material peaks at around 4 h, and while the city sunset occurs between 8 h and 9 h, the temperature remains high until after midnight, resulting in PMVs ranging from -1 to 1 for ZD, as opposed to ZA, AB, and ZC. However, from 7 h, the value of PMV begins to rapidly increase for the zone ZD by exceeding the upper limit of comfort at 7 h and reaching extreme discomfort levels (PMV greater than 4) between 2 h and 17 h.
Conclusion Remarks
This paper focuses on the impact of urban vegetation areas on the urban microclimate and outdoor thermal comfort. Four scenarios were evaluated during a summer day in the sub-humid climate of Rabat including that of urban agriculture zone as they are still exist in several Moroccan cities. Comparing the main microclimatic parameters namely 2 m air temperature, surface temperature, relative humidity and wind speed, Mean Radiant Temperature, and the comfort index PMV provides several results. The study is a correlation between qualitative analysis based on morphological indicators and 3D numerical simulation using ENVI-met 4.4.2 validated experimentally. The measurements were carried out using weather station PCE-FWS-20 installed respectively on two positions at street canyons selected from ZD and ZB on July 6th, 2022. The level of uncertainty for the ENVI-met 4.4.2 model, represented by the RMSE in %, is 0.97 (3% of the air temperature average value in ZD) and 0.98 (4% for ZB). The significantly high R² values confirmed that the model best matches the experimental data. The studied zones are the urban forest Ibn Sina (ZA), the public park Hassan II (ZB), an urban agriculture area in the Bouregreg Valley (ZC), and part of the Souissi district characterised by abundance of private gardens and presence of trees in the streets (ZD).
The comparison shows that even with a vegetation percentage of almost 50%, the half-built scenario records air temperatures much higher than the fully vegetated areas. This difference is maximum at 7 h, and it reaches 3.5°C. The results prove that the insertion of vegetation in urbanised areas in the form of a private garden or tree alignment in the main streets cannot compensate for the advection refreshment effect that can be created by a sizeable vegetated area such as an urban forest, a public park or even a preserved UA area in the centre or on the outskirts of the city. The surface temperature is higher for ZD area because the mineralised ground absorbs direct and reflected radiation more than natural soil, affecting the radiation balance. The recorded wind speed remains acceptable for all scenarios studied, knowing that the dynamic effects of the wind modify the individual’s behaviour and hinder his movements from a rate greater than 5 m/s [29]. The relative humidity is lower between 4h and 10h in the half-built scenario ZD than in the vegetated ones but higher during the remainder of the day. It is due to the sub-humid climate of Rabat and the evapotranspiration of plants. The urban forest zone ZA presents a PMV values between -1 and 1 during the daytime. ZB and ZC record PMV levels ranging between 1 and 3 from 9 h to 19 h and it is very hot between 11 h and 18 h for ZD. The main result that is ZB and ZC record comparable PMV levels knowing that it is the minimum level of refreshment that ZC zone can provide because it was evaluated after harvesting and as a no-irrigated zone. The highest contrast in thermal comfort provided passively on a typical summer day is 12 hours recorded between ZA and ZD and 6 hours between ZC and ZD. It is sometimes impossible to create enough parks in the centre of large cities and dense urban areas. The preservation of the cultural and natural heritage, urban forests and urban agriculture, thus contributes to the image and identity of the city and is an asset for the establishment of landscaping contributing to the sustainability and resilience of these spaces.
The urban forest zone ZA presents an acceptable level of thermal comfort during the daytime by PMV values between -1 and 1, contrary to ZB and the UA zone ZC, which record PMV levels ranging between 1 and 3 from 9 h to 19 h. Remarkably, the UA zone gives results very close to those of the public park, knowing that this zone is simulated during the summer after harvest and for non-irrigated land, representing the minimum conditions in terms of refreshment capacity. Thus, in addition to its advantages in terms of food security, pollution reduction and heating due to transport, UA can also play the role of a public garden in improving the urban microclimate. However, public gardens remain a costly project that offers only one advantage of being an open vegetated space.
