


Introduction
Material and Methodology
Chemicals and glassware
Description of the reference material samples
General experimental procedure
Rinsing solution (Au analysis)
Determination of physicochemical parameters and elemental analysis of the SABS reference solution and water samples
Result and Discussions
Determination of the physicochemical properties of the water samples
Determination of isotopic lines and optimum conditions for ICP-MS elemental analysis
Analysis of the reference SABS solutions using standard and collision mode
Analysis of water samples using the standard and collision modes
Method validation
Conclusions
Introduction
Since the inception of the inductively coupled plasma (ICP), both optical emission (OES) and mass spectrometry (MS) techniques are widely used for trace element analysis across a diverse range of sample types. The ICP technique is credited with low detection limits, large dynamic range that expands up to 106 orders of magnitude as well as the ability to perform multi-elemental analysis [1]. These attributes make the ICP technique an indispensable analytical tool for trace (100 - 0.1 mg/L) and ultra-trace (< 0.1 mg/L) elemental analysis. The versatility of ICP-MS technique is evident in its application to environmental monitoring, where it is used to assess the levels of heavy metals and other pollutants in agriculture, construction metals, drinking water, air, etc. Both ICP techniques are mutually ISO-approved for water analysis [2]. The ICP-OES (EPA, Methods 200.8) [3] is recommended for the analysis of major (> 1%), minor (1 – 0.1%) and trace elements whilst the ICP-MS (EPA 200.7) [4] is recommended for both trace and ultra-trace elemental analysis. The quality of water used in the construction industry is crucial because it directly affects the strength, durability, and finish of cement-based materials such as concrete and mortar. Techniques such as the ICP-MS allow direct elemental analysis, which are commonly used because their high throughput ability, low cost and ease of use.
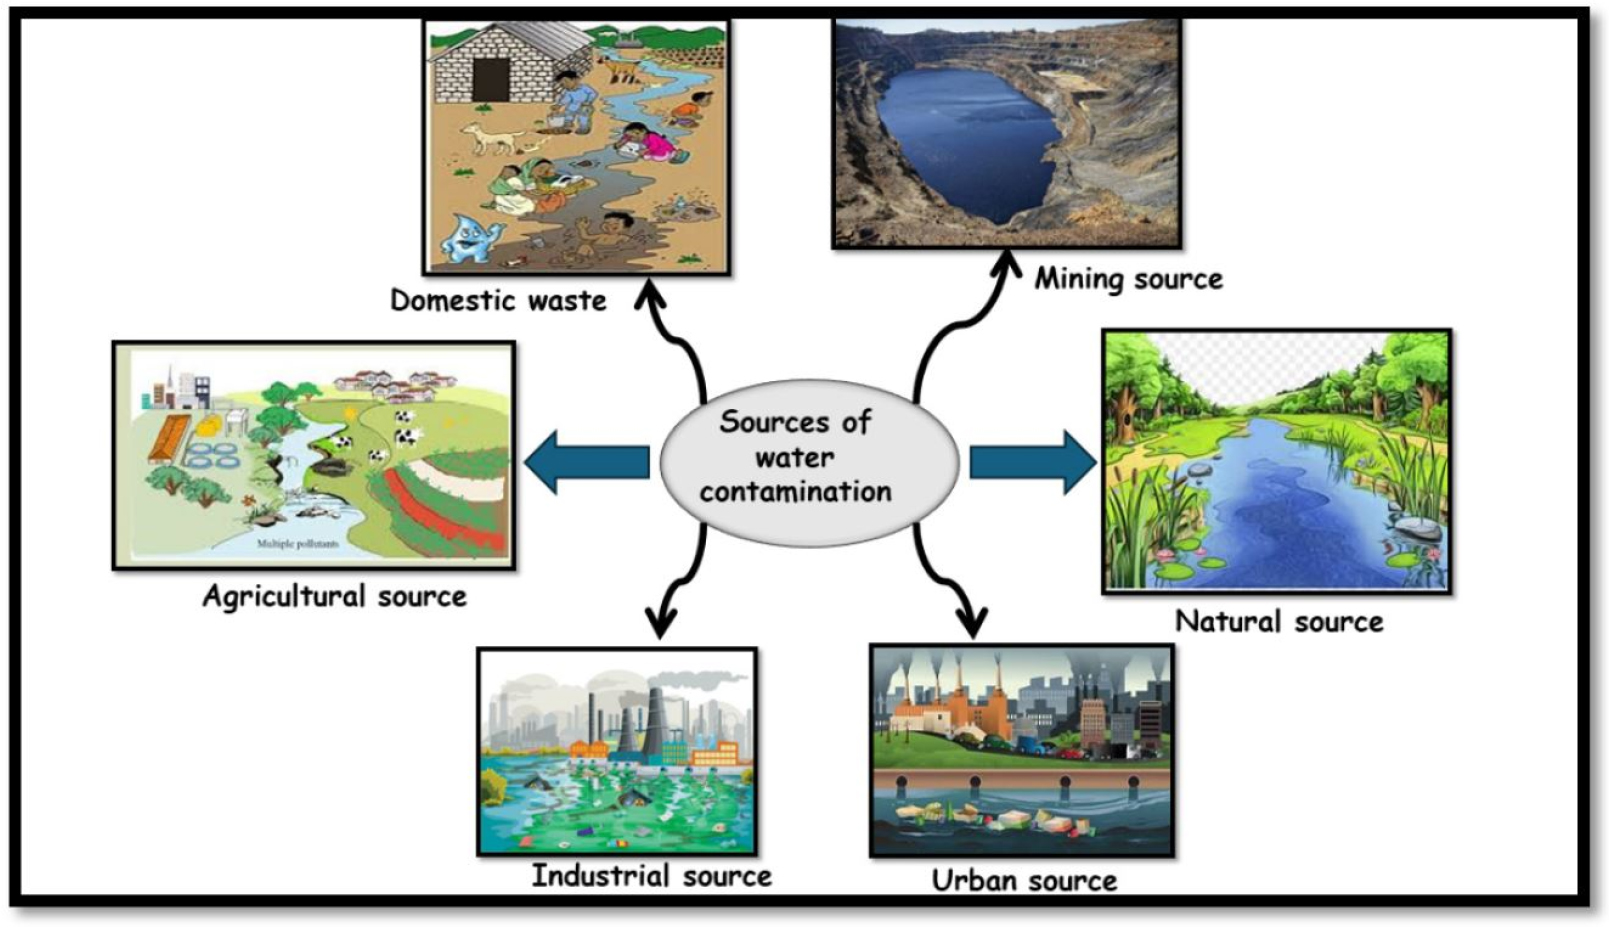
Elements such as As, Cd, Cr, Hg and Pb are often referred to as “toxic elements” because they pose severe health risks to the workers and public. The degradation and improper disposal of various construction materials and waste chemicals contributes significantly to the environmental contamination by toxic elements. The elements are difficult to study because of their low concentrations (µg/L) in samples, ionization issues, poor sensitivity and interference from the sample matrix. Research shows that water matrices are influenced by natural and anthropogenic (man-made) factors [5]. Examples of natural factors include groundwater, which flows through sedimentary rocks and other natural geological rocks containing toxic elements and species such as nitrates, fluoride, chloride, magnesium, iron, arsenate, and calcium. Man-made activities include agriculture, industrial factories, mining, and disposal of waste chemicals and toxic substances in urban areas, which contain toxic elements (Figure 1) [6].
Monitoring the toxic elements in both drinking and wastewater remains essential due to their devastating health effects. The maximum permissible concentrations of these toxic elements in drinking water according to the World Health Organization are 0.010 mg/L (As), 0.050 mg/L Cd, 0.100 mg/L Cr, 0.002 mg/L Hg, and 0.015 mg/L Pb [7]. Some of the notable effects caused by these toxic elements include disorders of the central nervous system, and damage to blood composition, lungs, liver, and kidneys [8]. According to epidemiological studies, ultra-trace amounts of Cd and Cr are a major cause of cardiovascular diseases, neurocognitive as well as kidney-related diseases [9]. The effects of Pb are associated with retarded physical and mental growth in infants whilst Hg and As are considered carcinogenic by the International Agency for Research on Cancer (IARC) [10]. Furthermore, As is considered a protoplasmic poison due to its catastrophic effects on body cells, which causes malfunctioning of cell enzymes, cell respiratory and mitosis [11, 12].
The vast developments in the ICP technique include improvement in sensitivity as displayed by an array of ICP-MS platforms such as the dynamic reaction cell (ICP-DRC-MS), collision and reaction cell (ICP- CRC-MS), triple quadruple (ICP-QQQ-MS), high resolution (HR-ICP-SF-MS), time of flight (TOF) (ICP- TOF-MS), Mattauch-Herzog (MH-ICP-MS), multi- collector (MC-ICP-MS), and quadrupole (ICP-Q-MS). Despite these developments, challenges still exist in elemental analysis of toxic elements in water [13]. Commonly used techniques, such as the direct calibration technique are susceptible to matrix interferences and lack sensitivity to detect low concentration levels of toxic elements. In the ICP-MS technique, using reaction or collision gas in direct elemental analysis shows promise in eliminating and minimizing the matrix effects caused by polyatomic and isobaric interference. The reaction mode (dynamic reaction cell, DRC) makes use of specific reaction gases (e.g., ammonia and oxygen) to eliminate known interferences from the analyte solution whilst the collision mode uses kinetic energy discrimination to selectively eliminate polyatomic ions interferences through loss of energy. The disadvantage of using the reaction mode is the formation of undesired cluster ions that forms new polyatomic species, which interfere with the analyte [14, 15]. The collision mode on the other hand, has wider application in selective attenuate polyatomic interferences in various biological, clinical, and environmental samples, even in samples with undefined matrices. More so, the convenience of the collision technique is unmatched as no analyte or matrix- specific setup is required and works by eliminating all smaller - larger polyatomic ions with lower energy than the analyte ions of the same mass. Therefore, this study evaluated the standard and collision mode techniques in the analysis of toxic elements in various water types. Four water types, groundwater, surface water, treated water and wastewater, were used to determine the degree and nature of the matrix compatible with the current method. The method was validated using the South African Bureau of Standards (SABS) water samples to ensure validity, traceability of results and fitness for purpose.
Material and Methodology
Chemicals and glassware
The analytical grade HNO3 acid (69%, purity 99.99%) together with the Ultra spec multi-element standard (As, Cd, Cr, and Pb; 1000 mg/L), mercury standard (10 mg/L) and gold (1000 mg/L) standards were purchased from De Bruyn Spectroscopic Solutions, South Africa. The polystyrene Greiner round bottom test tubes (12 mL, 16 x 100 mm) for wet chemical analysis were purchased from Sigma-Aldrich chemical company. The reference solutions (RS) were supplied by the SABS whilst the water samples were provided by the Institute for Groundwater Studies (IGS lab) of the University of the Free State. De- ionized water (0.01 µS/cm) used for dilutions and cleaning purposes was prepared using a Thermo Scientific Barnstead Nanopure Water Purification System (supplied by Sepsi Company). The volumetric flasks and glass beakers used in this study were Blaubrand and Schott Duran type respectively.
Description of the reference material samples
The SABS solutions (250 mL) used for the proficiency- testing scheme (PTS) for demonstrating competence in water testing laboratories were used as reference solutions. According to the certificate, the reference samples were prepared using ground water, surface water and wastewater, and the procedure for preparation is kept confidential. Each set of reference solution contained different matrices shown in Table 1. Reference solutions SABS 01 – 03 contained Cr, Pb, Hg and Cd whilst reference solutions SABS 04 – 06 contained As. The certified values in Table 2 were determined at a 95% confidence level with a z-score of ±1.96 (Equation 1).
Table 1.
Elemental matrix composition in the SABS reference solutions and water samples
Table 2.
Quantitative results of Cr, Pb, Hg, Cd and As using the standard and collision mode
| Element | Reference material code | Certified concentration (µg/L) |
Standard mode (µg/L)* |
Collision mode (µg/L)* |
| Cr | SABS 01 | 88.83 ± 3.78 | 84.34 (-1.19) | 88.95 (0.03) |
| SABS 02 | 295.37 ± 8.54 | 273.82 (-2.52) | 291.30 (-0.48) | |
| SABS 03 | 479.30 ± 13.26 | 429.91(-3.72) | 479.91 (0.05) | |
| Pb | SABS 01 | 88.00 ± 5.90 | 82.56 (-0.92) | 82.00 (-1.19) |
| SABS 02 | 442.80 ± 15.07 | 419.92(-1.52) | 424.94 (-1.09) | |
| SABS 03 | 475.00 ± 16.30 | 459.34 (-0.96) | 474.81 (-0.04) | |
| Hg | SABS 01 | 7.85 ± 1.07 | 18.79 (10.22) | 8.86 (0.94) |
| SABS 02 | 27.44 ± 4.30 | 57.76 (7.05) | 32.20 (1.11) | |
| SABS 03 | 43.74 ± 6.11 | 108.57 (10.61) | 54.04 (1.69) | |
| Cd | SABS 01 | 59.36 ± 2.64 | 64.90 (2.10) | 57.43 (-0.73) |
| SABS 02 | 300.00 ± 13.45 | 326.40 (1.96) | 289.71 (-0.77) | |
| SABS 03 | 328.77 ± 15.57 | 372.43 (2.80) | 334.89 (0.39) | |
| As | SABS 04 | 73.37 ± 5.63 | 81.35 (1.42) | 75.26 (0.34) |
| SABS 05 | 118.77 ± 9.63 | 132.12 (1.39) | 123.52 (0.49) | |
| SABS 06 | 175.13 ± 10.87 | 196.07 (1.93) | 186.79 (1.07) |
General experimental procedure
Analysis of pH in the water samples was done using the Eutech CyberScan pH meter (pH 1500). Electrical conductivity, turbidity (nephelometric turbidity units, NTU) and alkalinity were determined using YSI Conductivity meter Model 3200, HACH 2100Q turbidity meter and EasyChem 200 automated discrete analyser, respectively. A Sartorius Proline Plus mechanical micro-pipette (100 – 1000µL) was used for dispensing accurate volumes of reagents and water samples. Elemental analysis was done using a Perkin-Elmer Nexion (model 2000c) ICP-MS using conditions set out in Table 3.
Table 3.
Selected ICP-MS operating conditions for elemental analysis using the standard and collision mode
Preparation of calibration standards and determination of the method detection limit
Multi-element calibration standard solutions containing As, Cd, Cr, Pb and Hg were prepared in the range of 1 – 50.0 µg/L for Hg and 1.0 – 500 µg/L for As, Cd, Cr and Pb using the original stock solutions. The solutions were acidified using HNO3 acid (1.0 mL, 69.0%) including the blank solution and homogenized before use. Ten replicate analyses of the blank solution for each element were performed using the selected isotopes 52Cr, 208Pb, 202Hg, 75As and 111Cd. The method detection limit (MDL) for each element was calculated according to Equation 2 as 0.086 (Cr); 0.011 (Pb); 0.073 (Hg); 0.043 (As); and 0.013 (Cd) µg/L. for standard mode and 0.064 (Cr); 0.004 (Pb); 0.012 (Hg); 0.022 (As); and 0.001 (Cd) µg/L for collision mode.
Where SDblank is the standard deviation of the blank and m the gradient of the calibration curve.
Rinsing solution (Au analysis)
The rinsing solution was prepared by mixing 1% HNO3 and 100 μg/L of the Au (1 000 mg/L) standard. The ICP-MS program was set to rinse every 60 seconds after each analysis to minimize the memory effect of mercury.
Determination of physicochemical parameters and elemental analysis of the SABS reference solution and water samples
Preliminary pH, electrical conductivity (EC), turbidity, alkalinity, and total dissolved solids (TDS) analyses of the water samples and reference SABS solutions determined the matrix composition. The reference SABS solutions and water samples were filtered using Sartorius grade 2 filter paper before ICP-MS analysis to remove any insoluble or suspended particles. The filtrate solutions of the water samples were collected in separate volumetric flasks (100 mL) and acidified using NHO3 acid (5%). Aliquots of the SABS reference and water samples were pipetted into separate polystyrene test tubes (10.0 mL) and analyzed in triplicate.
The TDS of the SABS reference solutions was calculated using the mathematical correlation between EC and TDS, shown in Equation 3. The TDS concentrations of the SABS samples were calculated using the conversion factor of k = 0.75, which was indicative of the number of ions present in water [16]. The m-alkalinity or total alkalinity was deter-mined at the existing pH values of water according to Equation 4.
Result and Discussions
Determination of the physicochemical properties of the water samples
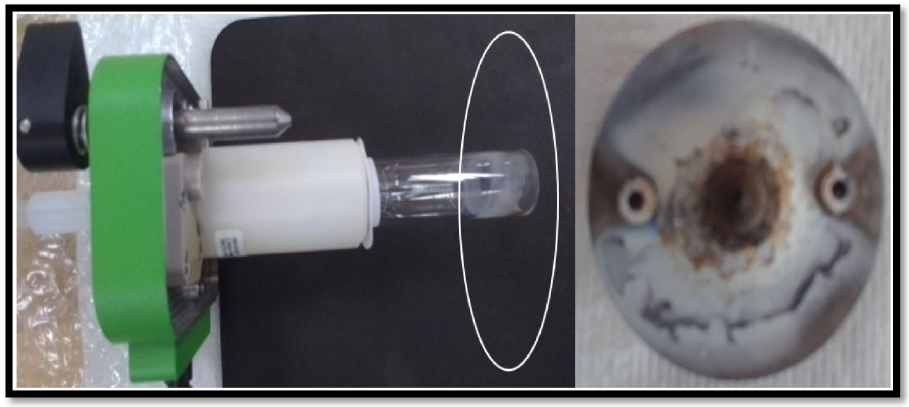
Parameters that affect measurements in ICP-MS such as pH, EC, turbidity, alkalinity, and TDS, were examined. The matrix composition in the SABS reference and water samples were assessed before elemental analysis to determine the permissible matrix levels for this method. The TDS was first assessed by probing the sample introduction system of the ICP- MS. Notably, the Meinhard concentric nebulizer (type A3) used in this study was limited to 1% (10 000 mg/L) TDS concentration and is highly recommended for samples with TDS below ~0.5%. It was therefore critical to determine the TDS content of each sample to ensure that the TDS concentration was within the prescribed limits of the method. A simple test to determine the effect of high turbid samples (> 0.5% TDS) showed the depositional action of the dissolved salts on the ICP-MS cones and torch, as shown in Figure 2. This affected nebulizer data collection, called drift, as well as the method’s sensitivity, which caused a significant reduction of the analyte response signal.
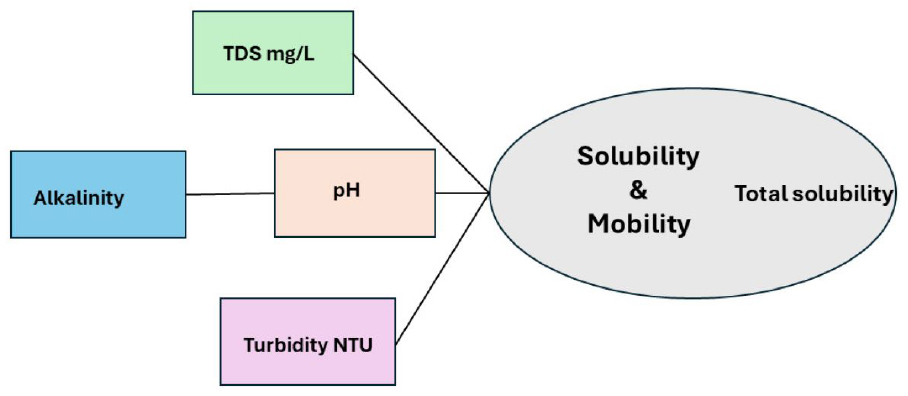
Other parameters such as pH and turbidity (NTU) were also determined before the ICP-MS analysis. Analysis of pH was key to avoiding acid-derived matrices as well as problems related to unmatched acid matrices between the samples and calibration standards. The effect of TDS, turbidity, alkalinity and pH, as shown in Figure 3, has the potential to influence the solubility and mobility of the trace elements, which is a critical component in the analysis of liquid samples using the ICP technique. Furthermore, significant changes in these parameters have the potential to alter the chemical speciation of trace elements, thereby affecting the sample’s chemical composition as well as the analyte load in the solution.
The SABS reference solutions’ pH ranged from 1.80 to 2.08 and the turbidity was less than 1.0 NTU for all the samples. The EC for SABS samples 01 – 03 were 54, 58 and 55 µS/cm respectively, and for SABS samples 04 – 06 were 101, 103 and 100 µS/cm, respectively. The conversion factor of k = 0.75 in the TDS concentrations of the SABS sample were calculations indicated the number of ions present in water [17]. The conversion factor varies with the ionic composition of the water sample, pH and alkalinity. The TDS for the reference samples SABS 01– 06 were 41, 44, 41, 76, 77 and 75 mg/L respectively. The TDS of the reference samples were all within the 0.5% criteria and specified limits of the nebulizer (Figure 4).
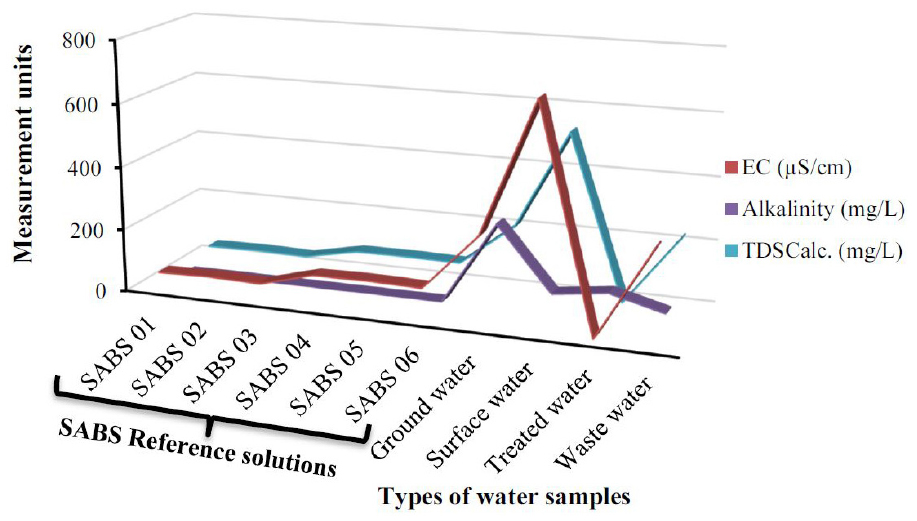
The pH of the water samples was in the range of 7.5 ≤ pH ≤ 8.5. It is important to note that in this pH range, the bicarbonate and carbonate ions are predominant whereas hydroxyl ions are prevalent at pH ~12. The effect of high alkalinity is the occurrence of easily ionizable elements (EIE) in the form where M is alkali metals), which has the potential to alter the flame property and cause salting out effects thereby adversely affecting accuracy. The alkalinity of the water samples was 44.79 mg/L (wastewater), 66.29 mg/L (surface water), 88.81 mg/L (treated water), and 269.04 mg/L (ground water).
Wastewater recorded high turbidity values (11.0 NTU), which was most likely the result of dissolved or suspended particulate matter and microscopic organisms. It is well-known that samples with high turbidity provide attachment places for pollutants such as bacteria and other organic and inorganic substances to cloud the water. These samples require stringent filtering before analysis to evade blockages of the nebulizer and other physical interferences. Ground water recorded 0.24 NTU due to the inherent self- filtering process in the ground. The turbidity of the surface water sample was higher (4.41 NTU) than treated water (0.80 NTU), which was within the acceptable range for drinking water (< 5 NTU) as defined by the World Health Organisation (WHO). The EC of the water samples were in the order of 266 µS/cm (wastewater) < 339 µS/cm (treated water) < 700 µS/cm (surface water) < 6008 µS/cm (groundwater). The estimated TDS concentration, according to Equation 2, was 200 mg/L (wastewater), 254 mg/L (treated water), 529 mg/L (surface water), and 4 506 mg/L (groundwater), which was within the permissible concentration limits for the ICP-MS nebulizer.
Determination of isotopic lines and optimum conditions for ICP-MS elemental analysis
Prior to the elemental analysis of Cr, Pb, Hg, As and Cd, ideal isotopic lines for quantitative analysis were selected by probing the less interfered mass lines (isotopes) and examining the sample matrix. Isotopes exhibiting high natural abundances were selected for 52Cr (83.79%), 208Pb (52.40%), and 202Hg (29.86%) and including 75As (100.00%), which was non-isotopic. Due to several potential polyatomic interferences for 111Cd such as 95Mo16O+, 94Zr16O1H+ and 39K216O21H+, the third abundant isotope 111Cd (12.80%) was used. Common polyatomic ions affecting 52Cr analysis are 40Ar12C, 36S16O+, and 35Cl16O1H, with 202Hg affected by186W16O+. Polyatomic species affecting 208Pb is 192Pt16O+ and 75As are 59Co16O+, 36Ar38Ar1H+, 36Ar39K, 40Ar35Cl, 43Ca16O2, 23Na12C40Ar, and 12C31P16O2+[18]. The use of hydrochloric acid was avoided to minimize the formation of polyatomic ions, which affects As and Cr species, such as 40Ar35Cl, 38Ar37Cl+, 35Cl16O, 35CI17O+, and 35Cl16OH, all with the potential to interfere with the analysis [19].
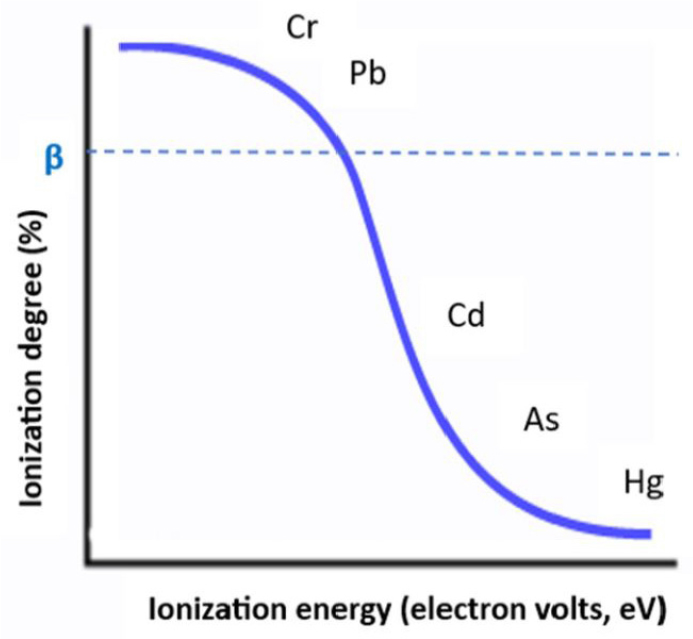
It is well known that the argon plasma in ICP-MS plays a key role in decomposing the sample matrix and ionizing analyte elements. The degree of ionization of toxic elements varies with the plasma temperature. At temperatures up to 7000°C, approximately 75% of these elements are ionized (Figure 5). To ensure maximum sensitivity in the plasma, the carrier gas settings were set according to Table 1. Under ordinary plasma conditions, the carrier gas (nebulizer gas flow), which carries the aerosol droplets from the spray chamber to the plasma, is usually set at 1.0L/min. Contrary to this, a lower carrier gas velocity was used (0.96L/min) to achieve the maximum exposure of the aerosol droplets in the hottest part of the argon plasma and decomposition of the sample matrix.
Analysis of the reference SABS solutions using standard and collision mode
Cadmium analysis in reference solution
The ICP-MS analysis conditions were set out in Table 3 for the recovery of Cd, Cr, Hg, Pb and As elements. Acid matrices between the calibration and analyte sets were matched using nitric acid to prevent errors in the solution uptake rate and nebulization efficiency as well as the formation of different ionic species. Cadmium forms several species in acidic and aqueous solutions such as Cd(NO3)2, Cd(OH)+, Cd(OH)2 and other hydrated species such as Cd(NO3)2 •xH2O, where x = 1, 2, 3, … depending on the pH of the solution. However, when dissolved in hydrochloric acid, cadmium forms CdCl+, CdCl3-, CdOHCl and other hydrated species, CdCl2•xH2O. This variation in cadmium speciation often brings about differences in mobility and solubility in solution, which affect accuracy and precision. Acid matching using nitric acid circumvented this problem and recoveries of 109.33% (SABS 01), 108.80% (SABS 02) and 113.28% (SABS 03) were obtained using the standard mode. The collision mode showed recoveries of 96.75% (SABS 01), 96.57% (SABS 02) and 101.86% (SABS 03).
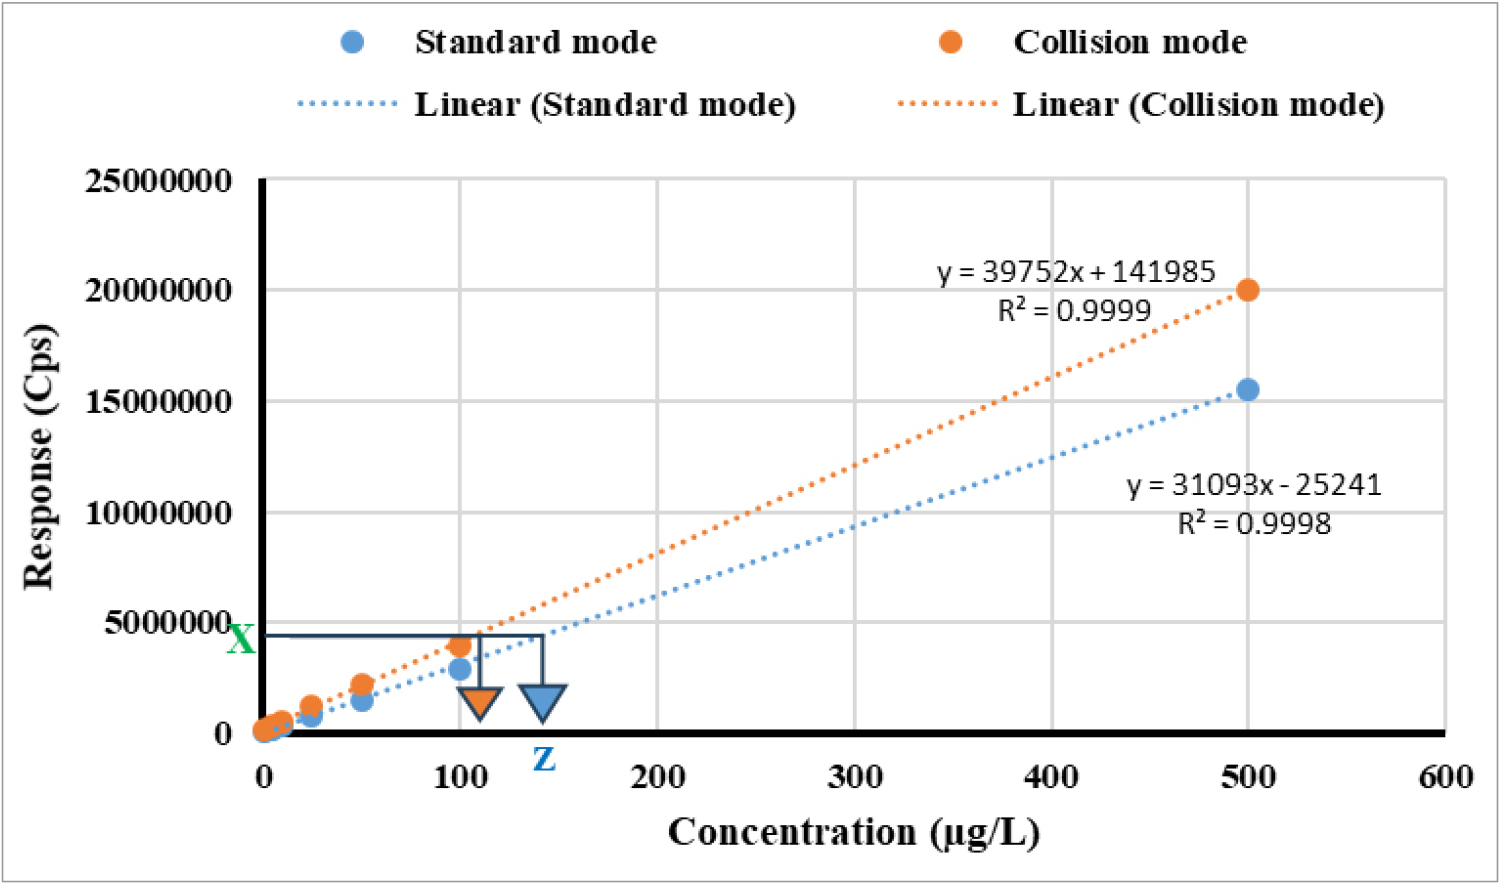
Another notable contrast in the results was the sensitivity difference between the slopes of the two calibration curves obtained from the standard and collision modes, as shown in Figure 6. The sensitivity (gradient) of the standard mode was lower than that of the collision mode. This sensitivity difference was attributed to the effects caused by factors identified previously (see Figure 3), which were beyond the proficiency and limits of the external calibration method. The sensitivity drift caused false high (Z) recoveries depending on the degree and complexity of the sample matrices. The other minor possibility of the false high recoveries was the enhancement of the analyte signal (X) due to polyatomic interference in the standard mode.
Chromium and lead analysis in reference solution
Quantitative results of chromium and lead reference solutions 01- 03 are provided in Table 2. The standard mode showed a negative z-score for both chromium and lead, which indicated under recoveries from the certified values. These results were contrary to the false high recoveries of cadmium obtained using the same technique. An error margin of between 10 – 15% (standard mode) and below 5% (collision mode) were reported and attributed to the suppression/ enhancement effects of the analyte signal. It is well known that speciation of chromium ions (Cr3+, CrOH2+, Cr(OH2)+, Cr(OH)3, Cr(OH)4-, etc.) [20, 21, 22] and lead ions (Pb2+, PbOH+, Pb(OH)2, etc.) [23] in water is due to pH variation affecting the analyte signal. The standard mode was more susceptible to these changes as seen by the negative z-score (-3.72 ≤ z ≤ -0.92) in both Cr and Pb, which was the result of suppression of the analytical signal. Large deviations from the certified values were observed at higher concentrations above 400 µg/L for both elements. Results from the collision mode were within the acceptable criteria (z < 1.96), which clearly showed the ability of the method to correct for polyatomic interferences.
Arsenic and mercury analysis in reference solution
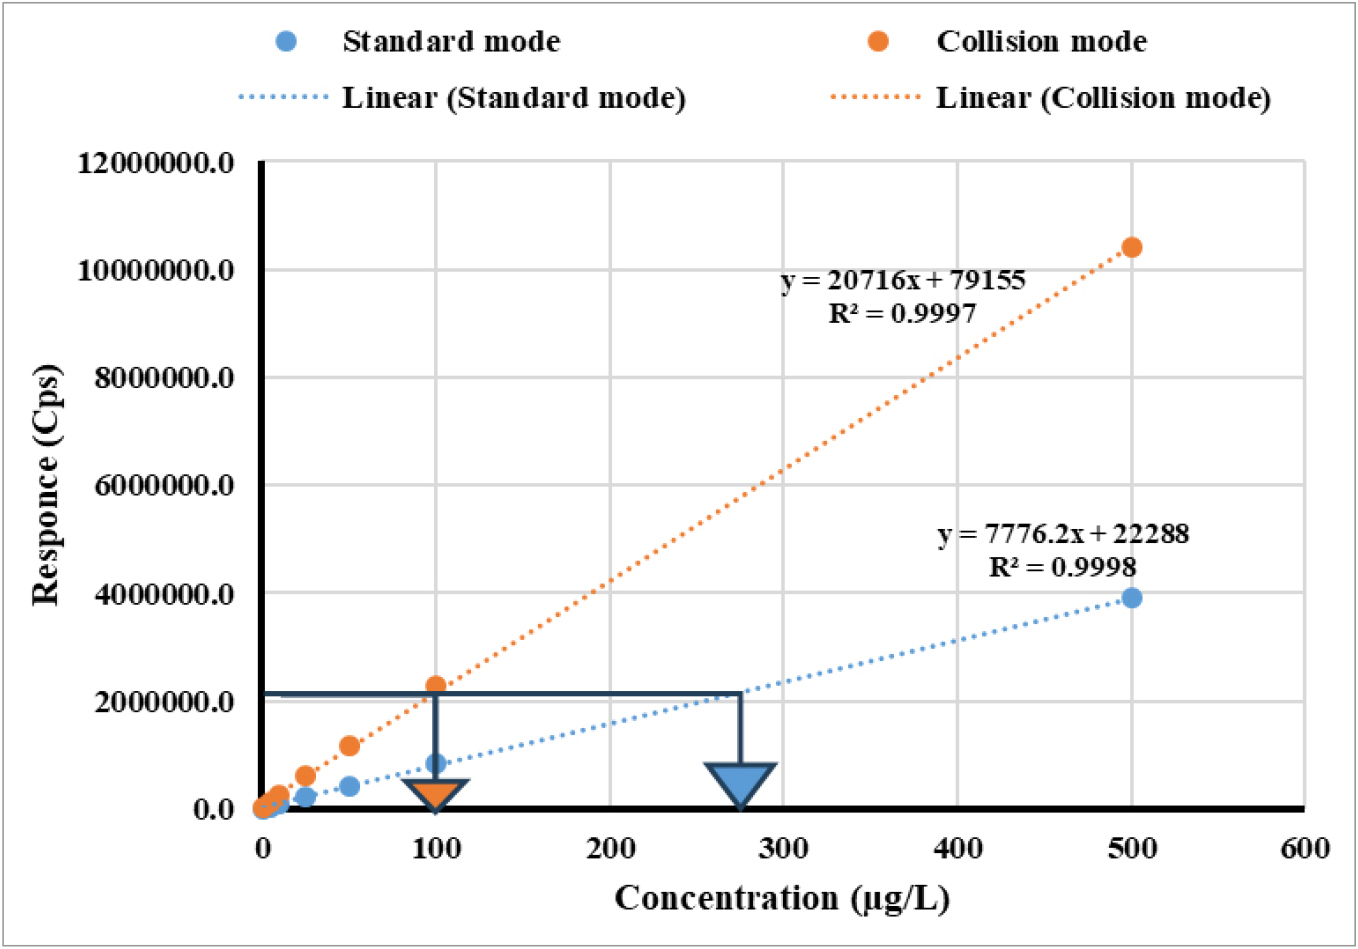
Arsenic and mercury are the least ionized elements, and their analysis success requires thorough pretreatment and analysis conditions. Preliminary analysis using samples stabilized in nitric acid showed satisfactory arsenic results with z < 1.96 despite the variation in EC and TDS values (see Figure 4). However, unsatisfactory recoveries (z > 3) were obtained under the same conditions for Hg, which prompted further investigation. It is well known that Hg analysis using ICP is complicated by memory effects i.e., the presence of residual analyte residues from the previous sample [24]. Memory effects usually result in biased and compromised outcomes, which affects the accuracy and credibility of analytical results. Several techniques have been developed to circumvent this problem and includes sequential rinsing of the sample introduction system with complexing agents like hydrobromic acid [25], ammonia, gold [26, 27], ethylenediaminetetraacetic acid (EDTA) [28], 2-mercaptoethanol, L-cysteine, or surfactants such as Triton-X. Some of the setbacks in using these techniques include signal enhancement (Triton-X), signal suppression (organic acids and HCl), long rinsing times and deposition of carbon on the cones due to the presence of organic chemicals [29]. Although the use of gold is prominent [30], the technique has not been fully adopted in commercial water industry due to high cost and high labour demands involved in sample preparation [31]. Instead, a rinsing solution containing nitric acid and the gold standard was established to amalgamate with mercury. The rinsing time was adjusted as described in the experimental section (120 sec) to minimize the memory effect in the sample introduction system. Remarkable results were obtained at this stage using the collision mode with all results having zscore < 1.96. However, unsatisfactory results were obtained using the standard mode, which again showed high recoveries with zscore > 1.96 due to sensitivity drifts (Figure 7).
Analysis of water samples using the standard and collision modes
The feasibility of the standard and collision mode techniques to quantify toxic elements were further evaluated in real water samples with unknown matrix composition. Pre-assessment of matrix composition was key to the success of this method and high alkalinity (45 – 270 mg/L), EC (28 – 705 µS/cm), and TDS (210 – 225 mg/L) values for water samples were obtained (see Figure 4) except for treated water samples. The differences in alkalinity, EC, and TDS values between the water samples and the reference solutions pointed to the possibility of complicated matrices in water samples. For instance, the difference in alkalinity, EC, and TDS between SABS 01 reference solution and the surface water were all above 85%, which indicated the level of robustness required to meet the accuracy limits defined in the reference standard (95%). Matrix complexity increased according to the order: treated water <groundwater <wastewater < surface water.
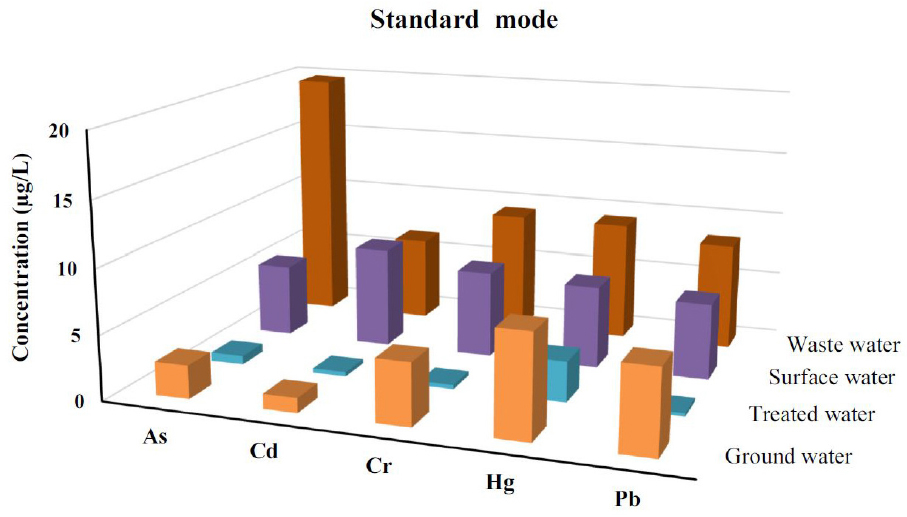
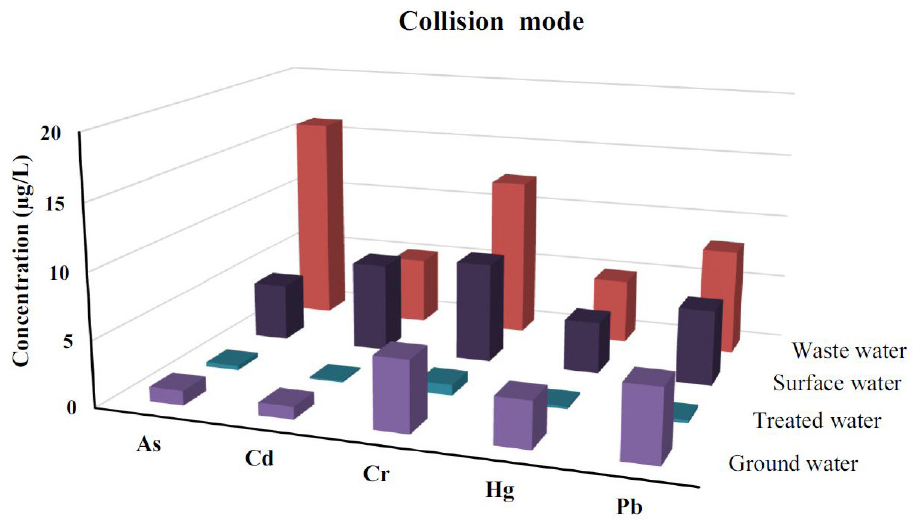
Quantitative results of water samples (Figures 8 and 9) show discrepancies in the results between the standard and collision modes. The differences in results were distinct in surface water and wastewater where the samples contained high TDS values (see Figure 4). However, smaller differences were observed for treated water and groundwater where the TDS was low. The standard mode was characterized by false-high recoveries, which was also evidenced in the As, Cd and Hg results for water samples. The error magnitude in the standard mode technique for water analysis was higher than in reference solution because of high TDS. The results from the collision mode were considered based on the validity of the method.
Method validation
The standard and the collision modes with conditions set out in Table 1 were validated to ensure fitness for purpose of these techniques. Validation parameters such as linearity and range, limit of detection and quantitation, accuracy, selectivity, and precision were determined to establish the operational limits of these two techniques. The acceptance criteria were statistically determined (see Equation 1). The zscore at a 95% confidence interval was used to determine if the results were within the acceptable range of the certified values. Results with zscore of less than 1.96 i.e., z ≤ 1.96 were considered or accepted whilst results with zscore of z ≥ 1.96 were rejected. Calibration curves from both the standard and collision modes were established in the range of 0-500 µg/L for As, Cd, Cr and Pb and 0 – 50 µg/L for Au. All calibration curves showed good linearity of at least R2 = 0.999. Lower detection limits for both the standard and collision mode were in the range of 0.064 – 0.086 (Cr); 0.004 – 0.011(Pb); 0.012 – 0.073 (Hg); 0.022- 0.043 (As); and 0.001- 0.013 (Cd) µg/L, which demonstrated the ability of both techniques to measure trace levels. The selectivity and sensitivity of the standard mode were prone to interference by polyatomic species, which compromised the precision, accuracy, and robustness of the method. Helium as reactive gas in the collision mode removed polyatomic interference and improved selectivity, sensitivity, accuracy, and precision of the method. Both techniques were not robust as they were affected by the changes in the matrix composition, which required an assessment of the sample matrix prior to analysis. Gold standard was shown to be a better alternative for circumventing the memory effect problems in collision mode.
Conclusions
The collision mode showed significant improvement in the trace analysis of toxic elements compared to the standard mode. Results obtained using the standard mode clearly showed the susceptibility to polyatomic interferences and sample-derived matrices. The efficiency of the standard mode depended on the matrix composition of the water sample. Samples with low TDS (< 200 mg/L) such as treated, and groundwater showed acceptable results (zscore < 1.96) compared to surface and wastewater samples with complicated matrix compositions. Surface water and wastewater recorded high TDS (>200 mg/L), which fell outside the acceptable criteria (zscore> 1.96). Effects of the polyatomic interference and sample matrix was the suppression and enhancement of the analyte signal, which resulted in false-low and false-high concentrations. The advantage of KED using helium gas was the ability to correct the polyatomic problems as well as to suppress the effects of sample- derived matrices, which resulted in the fluctuation of results.

