

Introduction
Research background
Traditional Discussions on Sustainable Urban Form
Theories of the relationship between urban form and sunlight
Analysis of energy and micro-climate using urban 3D model
Research methods
Result and Discussions
The annual average of sunlight hours
Sunlight hours of apartment type on winter solstice
The relationship between architectural elements and sunlight hours
Multiple-regression analysis
Strategy to increase sunlight hours
Urban form to reduce obstruction ratio on apartment type
Conclusion
Introduction
In the urban area, buildings create urban form and structure. The local environment determined by these urban forms affects people’s behavior in cities and buildings, and ultimately causes changes in energy consumption. The kind of micro-climate, the sunlight, is closely related to lighting, cooling, and heating energy consumption, as well as the comfort of residence. Generally, residential area with plenty of sunlight is preferred, so it is an important criterion for selecting a residence. Then, to secure sunlight, what kind of urban form would be advantageous? Regarding this, the purpose of the study is to analyze the influences on the sunlight in the urban areas which are formed by the buildings.
The questions of this study are as follows. First, is there a correlation between urban form and sunlight hours? In an analysis of the answer to this question, three types of residential areas were classified and architectural elements were derived. Applying these types, the amount of sunlight is quantified in terms of time and correlations are analyzed. Second, how does urban form influence on sunlight hours? In order to answer this, based on the results of correlation analysis, the regression analysis was carried out.
Research background
Traditional Discussions on Sustainable Urban Form
Up to recently, among the studies on sustainable urban development, the main keywords related to urban form are urban structure, urban density, urban environmental problems, transportation, and energy efficiency, etc. One of the main points of these studies is to improve energy efficiency through major urban development policy related to urban forms or urban structures, such as urban land use, transportation and town planning [1].
Energy efficiency problems were fixed in the concept of sustainable development, and compact urban theory began to dominate the discourse on sustainable urban forms [2]. Compactness and integration of land use clustered the destination of movement for commuting and school trip, and created more potential for public and non-motorized transport. Therefore, urban compactness is the most important factor in achieving sustainability, and sustainable cities should be compact, dense, diverse, and highly integrated [3].
The concentration of people’s behavior due to the compressibility of these cities is often recognized as a major environmental problem, but such concentration may also give environmental benefits by sharing resources. Using land more compactly and sharing infrastructure plays a role in reducing per capita energy in relation to construction and maintenance [4]. Compactness as a form of urban space includes the development of undeveloped urban land, redevelopment of existing areas, partitioning and conversion, and expansion [5].
A form is the result of many or fewer clusters of repetitive elements, and urban form is the result of bundling together many elements and concepts called urban patterns, a mix of land use patterns, traffic systems, and characteristics related to urban design [3].
In studies analyzing the relationship between urban form and energy consumption, the negative correlation was concluded between energy consumption and gasoline consumption per capita as urban or residential density increases [6, 7]. In this reason, the compact city concept was considered for high-density development to reduce traffic energy as a sustainable model.
Theories of the relationship between urban form and sunlight
Urban micro-climate is microscopic variation influenced by urban area depending on the form and physical characteristics. Temperature, wind, humidity, rainfall, and sunlight are representative cases of micro-climate, and these are affected by the urban form and built environment.
Jabareen (2006) argued that the external temperature, wind speed, and solar radiation exposure to individual buildings are not the ‘theoretical’ climate of the region, but rather the micro-climate that influenced by the geometry of the urban area [3]. When compared to the rural area, the urban area has more surfaces, and because of the wider exposure, more sunlight can be obtained. The exposed surfaces of the sunlight are significantly influenced by the type of built environment, the street’s width, and the orientation.
Since then, research has been conducted to demonstrate that micro-climate change due to the spatial characteristics of cities affects energy consumption. Steadman (1979) argued that urban density affects solar energy acquisition and energy consumption of buildings, additional lighting and energy demand would arise by limiting the opportunity for solar energy in the high-density area [8]. On the contrary, in the low-density, the opportunity to receive solar energy would increase the energy efficiency of buildings.
Owens (1991) studied the impact of urban forms on energy demand. He argued that urban form factors such as land use, layout, and design are related to the use of solar energy, which saves energy by cooling [9].
Hui (2001) argued that high concentration of buildings is possible to form a crowded and unpleasant local micro-climate [10]. The heat island effect in the urban area is the micro-climate that traps heat, and the demand for cooling energy is increased. In the building level of the high-density area, natural sunlight as micro-climate is generally reduced, and energy demand is increased due to artificial lighting and heating. On the other hand, thermal performance is improved by reducing the surface area of buildings.
Mitchell (2005) studied the influence of sunlight and wind on energy consumption [11]. Sunlight could reduce heating energy by providing natural light, increase cooling energy instead. The case of wind, it provides an opportunity to reduce the mechanical ventilation depending on the building design.
Analysis of energy and micro-climate using urban 3D model
Steemers (2003) analyzed the relationship between urban characteristics and building energy consumption through the Digital Elevation Model (DEM) in London [4]. He argued that the increase of obstruction angle reduces the solar energy’s acquisition and increases the energy demand of 6 ~ 15%. As the building’s average height increases, the obstruction angle increases. Accordingly, the amount of solar energy reduces and heating energy increases.
In the case of office building, if obstruction angle is increased by 10°, energy consumption is increased by 10%. If urban density is doubled, energy consumption is increased by 25%. The lighting energy consumption increases sharply due to the increase of the obstruction angle, the heating energy shows to increase as well. In the case of cooling, however, energy consumption decreases.
Ratti, Baker & Steemers (2005) selected a 400 × 400m area of analysis and constructed DEM (Digital Elevation Model) for three cities; London, Berlin, and Toulouse (southern France) [12]. In the research, the energy efficiency of urban form was analyzed using a factor of surface-to-volume ratio. They argued that to reduce heat loss, the surface area should be minimized, the other way, this leads to a reduction in the availability of sunlight and increases energy consumption for artificial lighting and ventilation.
LSE Cities & EIFER (2014) constructed a DEM for 500 × 500m sample areas of London, Paris, Berlin, and Istanbul [13]. In the study, it was analyzed the relationship between heating energy and density, building height, and surface-to-volume ratio. As a result, the heating energy consumption showed a negative relationship with the density and building height. Conversely, it was showed a positive relationship with the surface-to-volume ratio.
Steadman, Hamilton & Evans (2014) examined the relationship between the form of buildings and energy consumption [14]. In the research, ‘Virtual London Model’ was constructed as a DEM, and correlation and regression analysis between urban form and electricity and gas consumption were conducted. As a result, the correlation coefficients of floor area ratio for electricity and gas were 0.92 and 0.89, respectively, and the exposed surface area to 0.76, 0.82, and the height of the building to 0.43 and 0.51, respectively. In the multiple regression analysis, exposed surface area and total floor area were influenced on gas demand positively. Also, the exposed surface area influenced on electricity demand positively, but total floor area and the building height influenced negatively.
In this study, the sunlight is selected as a dependent variable which is directly influenced by the urban form. This assesses how much solar energy can be achieved as a major component of a sustainable urban form. Previous studies are conducted by using a digital elevation model of a real urban environment. Therefore, in this study, digital elevation model of the case in the urban area was applied as well. In terms of analytical factors, previous studies used the obstruction angle as the main variable among the urban form factors to examine the effect of solar energy on energy consumption. In this study, the general factors of urban form were selected including the obstruction angle to determine the impact on sunlight acquisition.
Research methods
The analysis sites were selected from representative residential areas of Seoul by referring to previous studies [15, 16]. In order to involve compatibility from the previous researches, the diversity of the urban space, and the characteristics of the residential area, 500 × 500 m scale of the analysis grids were applied.
The method of analyzing urban form and the amount of sunlight by constructing the urban 3d model has been utilized from the European studies to demonstrate energy consumption such as electricity and heating. In this study, the empirical analysis was used between the urban form and the sunlight hours by constructing the urban 3d model.
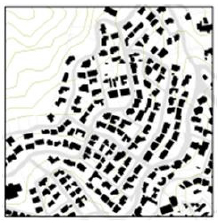
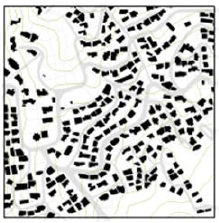
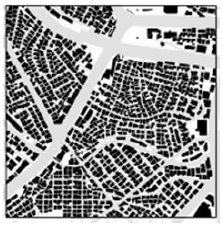
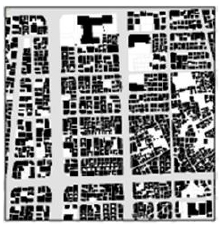
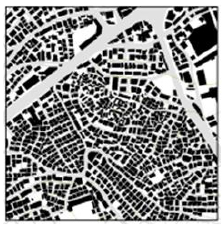
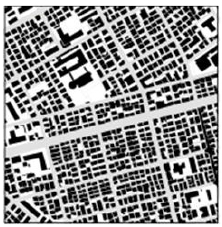
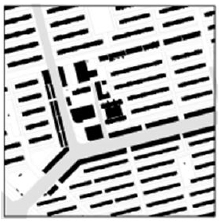
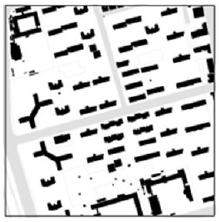
The research methods of this study are as follows. First, the literature reviews dealing with the relationship between micro-climate and energy consumption were conducted. Through this step, the architectural elements of urban areas to have relationship with and influence on the sunlight were derived. Second, the types of residential areas were based on previous studies on urban form in Seoul. The analysis sites were classified into low-rise type, apartment type, and mixed type, which were considered as representative residential types in Korea. Third, Digital Elevation Models (DEM) were constructed to derive the characteristics of urban form for the selected analysis sites. In addition, VRML (Virtual Reality Modelling Language) models were created for sunlight simulation.
Fourth, quantitative information of architectural elements and sunlight hours were collected for the 32 analysis sites. Fifth, correlation and multiple regression analyses were carried out to identify the relationship and influence between the architectural elements and sunlight hours’ results.
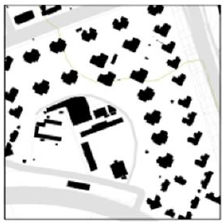
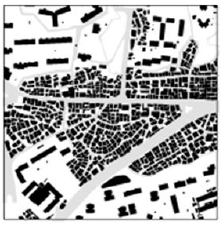
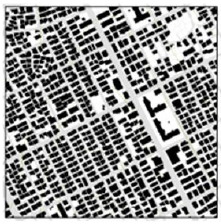
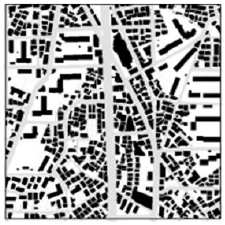
In this study, representative residential forms of Seoul, Korea were classified into three types; low-rise, apartment, and mixed. Low-rise type is a housing unit which is less than five-story and 15 meters in height. Apartment type is defined as high-rise and high-density housing unit. Mixed is a combination of low-rise residential houses and apartments. In the result, the 3 residential types of 32 analysis sites in Seoul are Table 1.
Table 1.
Residential types of analysis sites
The architectural elements of the residential area were selected as variables; building coverage ratio, floor area ratio, obstruction ratio, building height, height deviation (Table 2).
Table 2.
Operational definitions and data acquisition of variables
An annual average of sunlight hours was selected as the dependent variable factor. The Obstruction Ratio was operationally defined as a ratio of the building height with elevation to the building distance, which is similar to the ‘Sky Exposure Plane’ in the Zoning Regulation of U.S., and ‘Obstruction Angle,’ urban form factor in previous studies [4].
Result and Discussions
The annual average of sunlight hours
The analysis results of the annual average of sunlight hours by 32 sites were 5.1 hours for the low-rise, 4.5 hours for mixed, and 4.4 hours for apartment. The annual average of sunlight hours for all types was 4.7 hours, which was higher than the average for mixed and apartment types.
In the low-rise type, Seongbuk (6.4 hours) and Pyeongchang (6.2 hours) showed the highest sunlight hours. In the apartment type, Banpo1, which was a 5-story low-density apartment complex, marked 6.3 hours, the highest result. Apartment type, except for Banpo1, was below average for all cases. In the mixed type, the sunlight hours were less in Mia (4.1 hours) and Oksu (4.3 hours), which were being redeveloped to high-density apartments.
Sunlight hours of apartment type on winter solstice
The sunlight hours on winter solstice as the day of the lowest amount of sunlight during the year were analyzed for apartment type with relatively unfavorable sunlight conditions compared to low–rise or mixed type. As a result, Banpo 1 decreased from 6.3 hours of average to 6.0 hours of the winter solstice, Apgujeong decreased from 4.7 hours to 4.5 hours likewise.
Sanggye (from 4.6 to 3.8), Banpo2 (from 3.8 to 3.0) and Jamsil (from 3.5 to 2.9) had the major decrease. Jamsil showed the smallest amount in all cases even during the winter solstice and the annual average of sunlight hours. In the case of Dogok, there was less decrease from 3.6 hours to 3.4 hours (Table 3).
Table 3.
Statistic results of architectural elements and sunlight hours
| Residential types | Sites | BCR | FAR | OR | BH | HD | SH |
| Low-rise | Seongbuk | 19.9 | 59.7 | 1.6 | 7.2 | 16.6 | 6.4 |
| Pyeongchang | 19.9 | 58.3 | 1.7 | 6.9 | 17.5 | 6.2 | |
| Singil | 41.9 | 98.9 | 7.3 | 6.6 | 3.7 | 4.8 | |
| Jegi | 41.7 | 110.3 | 9.3 | 5.6 | 3.9 | 4.8 | |
| Tongeui | 38.4 | 106.0 | 8.6 | 6.0 | 6.4 | 4.8 | |
| Myeonmok | 43.5 | 119.9 | 7.6 | 7.6 | 3.9 | 4.8 | |
| Suyu1 | 27.2 | 95.2 | 4.0 | 7.1 | 8.9 | 5.3 | |
| Suyu2 | 45.3 | 131.9 | 8.2 | 8.2 | 4.2 | 4.5 | |
| Sangdo | 45.4 | 139.5 | 7.0 | 7.0 | 7.9 | 4.6 | |
| Mangwon | 43.0 | 166.6 | 5.5 | 9.9 | 4.6 | 4.6 | |
| Average | 36.6 | 108.6 | 6.1 | 7.2 | 7.8 | 5.1 | |
| Apartment | Banpo1 | 24.6 | 105.4 | 1.0 | 12.0 | 5.6 | 6.3 |
| Sanggye | 17.3 | 205.2 | 3.8 | 33.2 | 16.5 | 4.6 | |
| Apgujeong | 17.6 | 212.3 | 3.1 | 38.7 | 21.0 | 4.7 | |
| Dogok | 17.3 | 331.2 | 5.9 | 97.1 | 69.8 | 3.6 | |
| Seocho | 18.2 | 293.6 | 3.5 | 41.3 | 26.3 | 4.6 | |
| Jamsil | 17.2 | 320.1 | 8.5 | 60.2 | 22.7 | 3.5 | |
| Banpo2 | 14.6 | 286.9 | 4.5 | 64.4 | 26.2 | 3.8 | |
| Average | 18.1 | 250.7 | 4.3 | 49.6 | 26.9 | 4.4 | |
| Mixed | Geumho | 31.1 | 183.7 | 8.2 | 9.0 | 13.9 | 4.0 |
| Bangbae1 | 43.4 | 161.9 | 5.7 | 9.1 | 12.0 | 4.5 | |
| Banghwa | 34.7 | 165.4 | 5.3 | 8.9 | 6.7 | 4.8 | |
| Junghwa | 34.4 | 127.0 | 4.6 | 8.3 | 5.3 | 5.0 | |
| Yeoksam2 | 35.0 | 144.7 | 3.5 | 9.5 | 9.1 | 5.3 | |
| Bongcheon | 33.5 | 132.1 | 5.0 | 9.5 | 12.6 | 4.2 | |
| Namsan | 36.0 | 188.3 | 7.5 | 9.7 | 17.0 | 4.2 | |
| Gwonnong | 41.4 | 159.2 | 14.0 | 7.0 | 7.3 | 4.3 | |
| Jayang | 24.4 | 194.6 | 5.0 | 14.0 | 14.2 | 4.3 | |
| Sinwol | 34.0 | 176.3 | 4.8 | 11.5 | 9.2 | 4.6 | |
| Mia | 19.3 | 239.4 | 5.0 | 15.1 | 32.9 | 4.1 | |
| Bangbae2 | 34.1 | 164.8 | 5.3 | 11.6 | 7.1 | 4.7 | |
| Hannam | 27.2 | 165.3 | 3.3 | 12.3 | 16.2 | 5.0 | |
| Yeoksam1 | 39.3 | 202.5 | 6.0 | 13.9 | 7.0 | 4.2 | |
| Oksu | 22.2 | 242.6 | 5.2 | 16.5 | 29.0 | 4.3 | |
| Average | 32.7 | 176.5 | 5.9 | 11.1 | 13.3 | 4.5 | |
| Average | 30.7 | 171.5 | 5.6 | 18.3 | 14.5 | 4.7 | |
The relationship between architectural elements and sunlight hours
Pearson correlation was used as the analysis method. As a result, the sunlight hours was correlated with the floor area ratio (-0.764), obstruction ratio (-0.556), building height (-0.498), and height deviation (-0.396). There was no correlation between the sunlight hours and the building coverage ratio (Table 4).
Table 4.
Results of correlation analysis
| Variables | BCR | FAR | OR | BH | HD | SH |
| BCR | 1.000 | -0.506** | 0.552** | -0.632** | -0.672** | 0.001 |
| FAR | -0.506** | 1.000 | 0.085 | 0.813** | 0.710** | -0.764** |
| OR | 0.552** | 0.085 | 1.000 | -0.082 | -0.169 | -0.556** |
| BH | -0.632** | 0.813** | -0.082 | 1.000 | 0.818** | -0.498** |
| HD | -0.672** | 0.710** | -0.169 | 0.818** | 1.000 | -0.396* |
| SH | 0.001 | -0.764** | -0.556** | -0.498** | -0.396* | 1.000 |
Multiple-regression analysis
In the regression analysis, the results were analyzed for all elements (Model 1), and the Model 2 was derived by selecting the variables depending on the influence and significance of the independent variables.
In Model 1, the estimated coefficient of floor area ratio was -0.889 (p-value 0.000), which was the most influential form factor as standardization coefficient. The obstruction ratio was -0.355 (p-value 0.002), and it was analyzed to be influential next to the floor area ratio. On the other hand, the significance probability of building coverage ratio was 0.104, and the height and height deviation is 0.526 and 0.643, respectively. As a result, the floor area ratio and obstruction ratio were considered as variables that significantly affected the sunlight hours.
Model 2 was the result of the regression analysis of sunlight hours with two factors, floor area ratio, and obstruction ratio. Compared to model 1, the unstandardized coefficient and the standardized coefficient were decreased for the floor area ratio. Decreasing the standardization coefficient means that the influence was smaller. In case of obstruction ratio, both the unstandardized coefficient and the standardized coefficient were increased in Model 2. This means that the explanation of the obstruction ratio was increased. It is interpreted that the explanation of other elements including the floor area ratio in Model 1 was converted to the obstruction ratio. The significant probability (p-value) of the obstruction ratio was decreased from 0.002 to 0.000, and the significance for the sunlight hours was increased (Table 5 and 6).
Table 5.
Regression coefficient of model 1 and model 2
| Architectural elements | Model 1 | Model 2 | |||||||||
| α | β | t | γ | VIF | α | β | t | γ | VIF | ||
| BCR | -0.015 | -0.230 | -1.686 | 0.104 | 3.250 | - | - | - | - | - | |
| FAR | -0.009 | -0.889 | -6.388 | 0.000 | 3.373 | -0.007 | -0.722 | -9.302 | 0.000 | 1.007 | |
| OR | -0.093 | -0.355 | -3.364 | 0.002 | 1.942 | -0.129 | -0.494 | -6.364 | 0.000 | 1.007 | |
| BH | 0.003 | 0.106 | 0.643 | 0.526 | 4.715 | - | - | - | - | - | |
| HD | -0.004 | -0.067 | -0.468 | 0.643 | 3.524 | - | - | - | - | - | |
| Constant | 7.145 | - | 21.767 | 0.000 | - | 6.604 | - | 38.115 | 0.000 | - | |
Table 6.
Results of regression model
| Model 1 | Model 2 | |
| R | 0.922 | 0.909 |
| R2 | 0.851 | 0.826 |
| F | 26.609 | 69.069 |
| Significant Probability (p-value) | 0.000 | 0.000 |
| Durbin-Watson | 2.250 | 1.972 |
The result of the multiple regression analysis derived from model 2 was shown in equation (1).
•= FAR (Floor Area Ratio)
•= OR (Obstruction Ratio)
Strategy to increase sunlight hours
The regression model showed that the most efficient type for sunlight hours was low-rise with low density. In the model, the floor area ratio and the obstruction ratio were negatively related to the sunlight hours. However, it is impossible to develop all the resident area into a low-density. Considering this, the obstruction ratio would be determined as an effective factor for securing sunlight.
By comparing cases with similar densities, the two methods of controlling the obstruction ratio for increasing sunlight were derived as Table 7. The two methods to increase the sunlight hours at similar density were lowering the obstruction ratio with the type of high-rise on low building coverage or low-rise on high building coverage.
Table 7.
Increasing sunlight hours at similar density
| Methods | Cases | Types | BCR | FAR | OR | BH | SH | Details |
| High-rise | Suyu1 | Low-rise | 27.2 | 95.2 | 4.0 | 7.1 | 5.3 | To increase the sunlight hours by lowering the obstruction ratio with high-rise |
| Singil | Low-rise | 41.9 | 98.9 | 7.3 | 6.6 | 4.8 | ||
| High-rise | Banpo1 | Apartment | 24.6 | 105.4 | 1.0 | 12.0 | 6.3 | To increase the sunlight hours by lowering the obstruction ratio with high-rise |
| Tongeui | Low-rise | 38.4 | 106.0 | 8.6 | 6.0 | 4.8 | ||
| High-rise | Suyu2 | Low-rise | 45.3 | 131.9 | 8.2 | 8.2 | 4.5 | To obtain less sunlight hours even with low obstruction ratio with low-rise |
| Bongcheon | Mixed | 33.5 | 132.1 | 5.0 | 9.5 | 4.2 | ||
| High-rise | Hannam | Mixed | 27.2 | 165.3 | 3.3 | 12.3 | 5.0 | To increase the sunlight hours by lowering the obstruction ratio with high-rise |
| Banghwa | Mixed | 34.7 | 165.4 | 5.3 | 8.9 | 4.8 | ||
| High-rise | Yeoksam1 | Mixed | 39.3 | 202.5 | 6.0 | 13.9 | 4.2 | To increase the sunlight hours by lowering the obstruction ratio with high-rise |
| Sanggye | Apartment | 17.3 | 205.2 | 3.8 | 33.2 | 4.6 | ||
| Low-rise | Mia | Mixed | 19.3 | 239.4 | 5.0 | 15.1 | 4.1 | To obtain less sunlight hours even with low obstruction ratio with low-rise |
| Oksu | Mixed | 22.2 | 242.6 | 5.2 | 16.5 | 4.3 | ||
| Low-rise | Banpo2 | Apartment | 14.6 | 286.9 | 4.5 | 64.4 | 3.8 | To increase the sunlight hours by lowering the obstruction ratio with low-rise |
| Seocho | Apartment | 18.2 | 293.6 | 3.5 | 41.3 | 4.6 |
Urban form to reduce obstruction ratio on apartment type
In South Korea, the population has been rapidly increased with high economic growth after the war. As a result, the urban area has been highly densified, and the housing type has been changed from low-rise detached housing to high-rise apartment. In 2008, the number of apartment exceeded detached housing, and the proportion of housing types in 2017 was 34.3% for detached housing and 48.6% for apartments. For this reason, it was necessary to analyze whether these changes in density and housing type have a positive or negative impact on securing sunlight. In the case of apartment type as high-density, additional analysis was performed as the sunlight environment was assumed to be relatively poor.
As a result of the analysis, the type of high-rise apartment had the possibility of affecting the sunlight hours according to the layout form. This was because the obstruction ratio varied depending on the building’s arrangement. For example, plate-shape buildings were arranged in a line, the obstruction ratio was the lowest and the sunlight hours were the highest. On the contrary, if the buildings were arranged in rectangular form, the distance between adjacent buildings was the shortest. So the obstruction ratio was highest and the sunlight hours were the lowest. As shown in the case of Seocho, the arrangement of the plate-shape buildings, showed the lowest obstruction ratio even if the building coverage ratio was highest. These implications can be taken into account for the building’s arrangement criteria in the residential area.
It can be seen that the arrangement affects the obstruction ratio when comparing the cases of Dogok, Seocho, Jamsil, and Banpo2 of high density apartments (Table 8). Seocho, which has the lowest obstruction ratio, is arranged in a plate-like shape. In the case of Jamsil, which has the highest obstruction ratio, it has a rectangular arrangement.
Table 8.
Residential types and sunlight hours of apartment sites
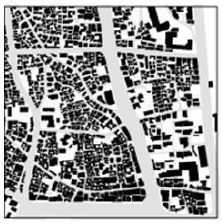
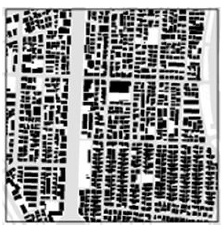
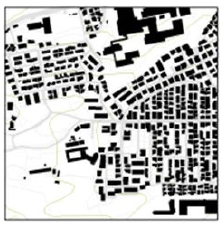
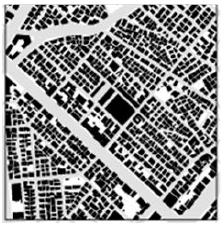
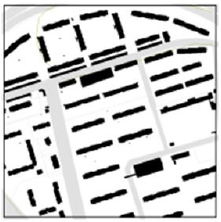
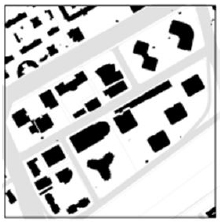
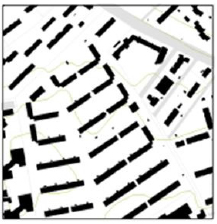
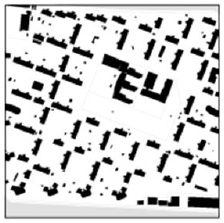
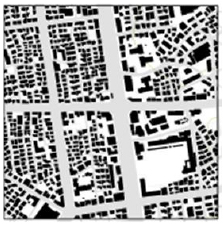
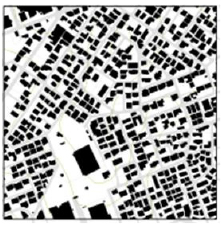
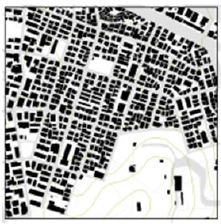
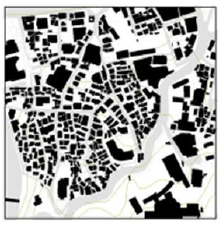
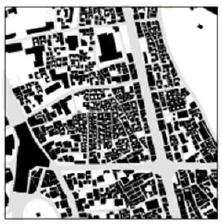
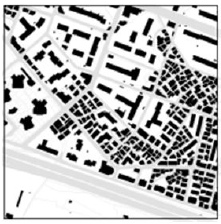
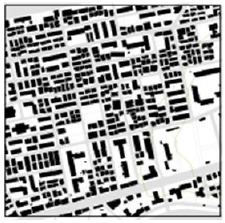
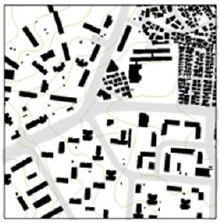
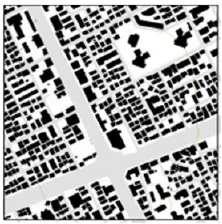
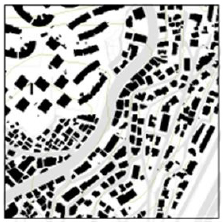
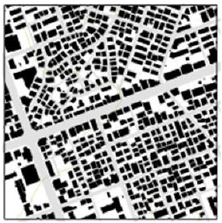
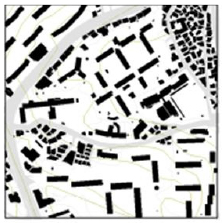
| Dogok | Seocho | Jamsil | Banpo2 | ||||||||||||
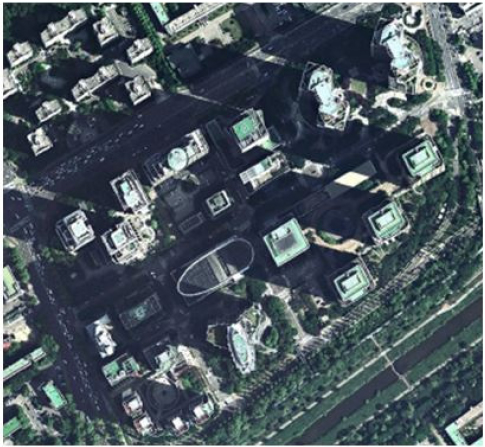 | 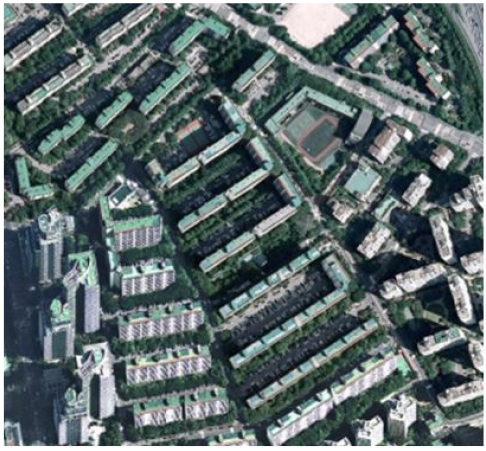 | 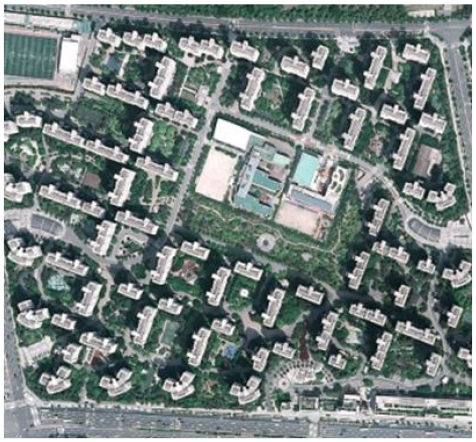 | 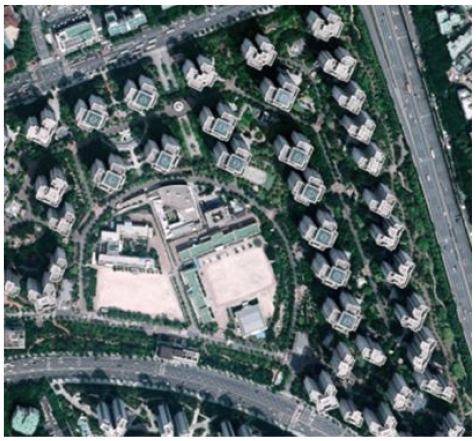 | ||||||||||||
| BT | OR | FAR | SH (WS) | BT | OR | FAR | SH (WS) | BT | OR | FAR | SH (WS) | BT | OR | FAR | SH (WS) |
| Tower | 5.9 | 331.2 |
3.6 (3.4) |
Plate- like | 3.5 | 293.6 |
4.6 (4.1) |
Tower (□) | 8.5 | 320.1 |
3.5 (2.9) | Tower | 4.5 | 286.9 |
3.8 (3.0) |
From the analysis of this study, there is clearly a negative effect on the sunlight hours from the buildings on the east and west side. Residential buildings located in east-west direction are basically disadvantageous to acquire sunlight and have a negative influence because they form a shadow on adjacent buildings.
In particular, in the case of high-density apartments, it is necessary to design the urban form and buildings layout to secure the right of sunlight.
Conclusion
The result of this study suggested effective residential forms for securing sunlight, and directions for future residential development. The most important result is that high-density development has a negative impact on securing sunlight. This relationship showed a contradictory implication with the relationship between density and gasoline consumption as a benefit of the compact city. The urban planning and management policy is not merely aimed at high-density cities, but rather should be considered the urban forms in terms of environmental and energy consumption including the sunlight.
As shown in the previous researches [4, 12], since the heating demand and lighting energy consumption are reduced, securing more sunlight by controlling the obstruction ratio is accompanied by the reduction of total energy consumption. The second meaningful conclusion, in the same density, the residential area with low obstruction ratio had an advantage for securing sunlight. The urban area should be designed to have a lower obstruction ratio at the same density, and managed by adjusting the building height in consideration of regional context.
The results of this study can be applied as a methodology of the urban planning and design for sustainable development. By applying this, it is possible to contribute to the implementation of the urban form that leads to low energy consumption behavior.
This study has limitations in not being able to directly analyze the relationship between sunlight and building energy consumption. Therefore, as a follow-up study, a study that reveals the relationship between the amount of sunlight and the energy consumption of buildings according to the urban form can be proposed.
