

Introduction
Literature review
Research methods
Data Collecting
NLP Data Preparation
Training, cross-validation and selection the models
Models Validation
Results and Discussion
EBM Databases investigation and collected data
Potential of NLP based ML on Building Material Eco-Label Databases Wrangling
Conclusions
Appendix
Introduction
The construction industry, a major contributor to global greenhouse gas emissions and resource consumption, is increasingly embracing sustainable practices to mitigate its environmental impact [1]. Green building materials (GBM), derived from renewable resources or recycled waste, offer a promising avenue for reducing the carbon footprint of buildings and promoting circular economies. However, the widespread adoption of GBMs is hindered by the lack of comprehensive and accessible information about their properties, performance, and environmental impacts [2].
Green building (GB) eco-label material databases serve as comprehensive information repositories, simplifying the comparison and selection of sustainable building materials [3]. They enhance transparency and credibility through eco-labels and certifications, fostering market growth for environmentally friendly alternatives. These databases play a crucial role in informing eco-labels, providing information in a user-friendly format. However, the current landscape of EBM databases is fragmented, with data scattered across various platforms, maintained by different organizations, and presented in diverse formats [4]. This fragmentation poses challenges for stakeholders attempting to compare and select EBMs based on specific criteria. Inconsistent terminology, data organization, and quality further complicate the extraction of meaningful insights.
On other hand, the combination of NLP and ML has the potential to revolutionize data management tasks such as error detection, data cleaning, integration, and query inference within databases [5]. By automating the extraction and codification of scientific literature, NLP techniques can generate rich datasets essential for data science and ML applications [6]. Additionally, NLP-based ML models have demonstrated effectiveness in analyzing incident narratives and classifying data accurately. In conclusion, the synergy between NLP and ML presents a powerful approach for enhancing databases’ efficiency and accuracy through automated data extraction, management, and analysis.
Considering these challenges, this research Leveraging NLP advantages to address these challenges, this research aims to introduce a conceptual model that combines natural language processing (NLP) and machine learning (ML) to streamline the wrangling of EBM databases. NLP techniques enable the extraction of relevant information from unstructured text, such as product descriptions, technical specifications, and environmental certifications. ML algorithms, on the other hand, can learn patterns in the data to standardize terminology, resolve inconsistencies, and integrate disparate information sources. The following sections of this manuscript will delve into a comprehensive literature review of existing research on GBM databases and the application of NLP and ML in data management. Subsequently, the research methods employed in this study, including data collection, NLP data preparation, and the training and validation of ML models, will be elucidated. The results and discussion section will present the findings of the research, including the analysis of collected data and the performance of the ML-NLP models in predicting eco-labels. Finally, the conclusion will summarize the key findings, discuss the implications of the research, and suggest potential avenues for future research.
Literature review
Recently, various studies have been conducted to develop a automation materials information management process by applying Information Technology (IT) [2]. Among them, BIM has been identified as a potential candidate that can assist in integrating the fragmented Architecture, Engineering, and Construction (AEC) industry by eliminating inefficiencies and redundancies, improving collaboration and communication, and enhancing overall productivity [7]. Thus, studies popularly have focused on managing and retrieving material information to perform calculations aimed at optimizing the sustainability of the building envelope in BIM models [8, 9]. These optimizations aim to achieve the goal of optimizing a building’s carbon emissions reduction [10, 11, 12], life cycle costs [3], or assessing compatibility with standard GB systems [8, 13]. Some studies also conducted thermal performance analyses using various sustainability simulation tools, applying material data extracted from BIM models [14]. With the conventional catalog-based method, regularly accessing the latest information to the BIM models poses a challenge. This is because it necessitates distinct actions to upload fresh data to ensure the product information remains up to date. This ongoing need to update SBMs management often leads to a time-consuming and labor-intensive process, resulting in an increased workload for the project team.
In summary, existing research on improving automation management of SBM Information (Table 1), often integrated with Building Information Modeling (BIM), are highly valued for their role in enhancing design and construction efficiency. The effectiveness of these approaches is significantly influenced by the quality of gathering and analyzing material data. However, significant challenges exist in identifying and collecting data of this process due to inconsistencies across databases. Numerous studies have aimed to address this issue by developing strategic guidelines, database management standards, and automated systems for information collection. Despite these efforts, the rapidly growing field of sustainable building materials (SBM) and the ever-evolving nature of SBM data make it challenging to keep these methods current. Combining various methods does not ensure access to the latest information, as updating the data requires substantial human resources, which can be both costly and time-consuming.
Table 1.
Existing research approaches for improving the collection and management of SBM Information
| Approach | Main purpose | Limitation |
|
Centralizing Data Repositories (Utilizing database and BIM Data) | - Utilize APIs from various databases to look up information, leveraging resources from different databases [15]. - Integration of databases and computational tools for real-time assessment in BIM [8, 16] and updating baselines for simulation data to ensure accurate and up-to-date simulations [17] | - Uncertain results [18] due to various participants. Quantity and quality of BIM databases is limited [1]. - Interoperability gap between BIM platforms and tools [19]. - The potential to operate a centralized platform is hindered by the large and continuously growing volume of SBM data. |
| Strategies to Creating Extensive Databases | - Standardizing data structures and formats to ensure consistency and compatibility across different databases [20, 21]. | - Due to variations in local scenarios, no universally adopted global guideline exists [4], leading to inconsistencies [15]. |
| Automating Data Classification | - Propose rules-based ontologies for automated data classification, reducing dependency on labor [2, 12] | - For each data source objects, rule-based need to be manually modified [2] |
On the other hand, ML-NLP classifiers outperform ontologies rule-based systems by continuously learning and adjusting to new and evolving scenarios. NLP models have shown their effectiveness in classifying and identifying information within data from various fields, such as medical [22] , safety engineering [23], finance and others [24]. Therefore, this study proposes the utilization of WebCrawler and ML – NLP(ML-NLP) models for increasing collection and analysis of SBM Information from various sources.
Then, the gathered data will be evaluated by a rule-based assessment according to the LEED requirements, which are crucial for ongoing evaluation needs in the project. This approach is designed to mimic the project team’s processes of collecting, analyzing, and managing SBM information but will automatically collect and analyze data from various sources, thus minimizing the risk of overlooking available SBM information.
Research methods
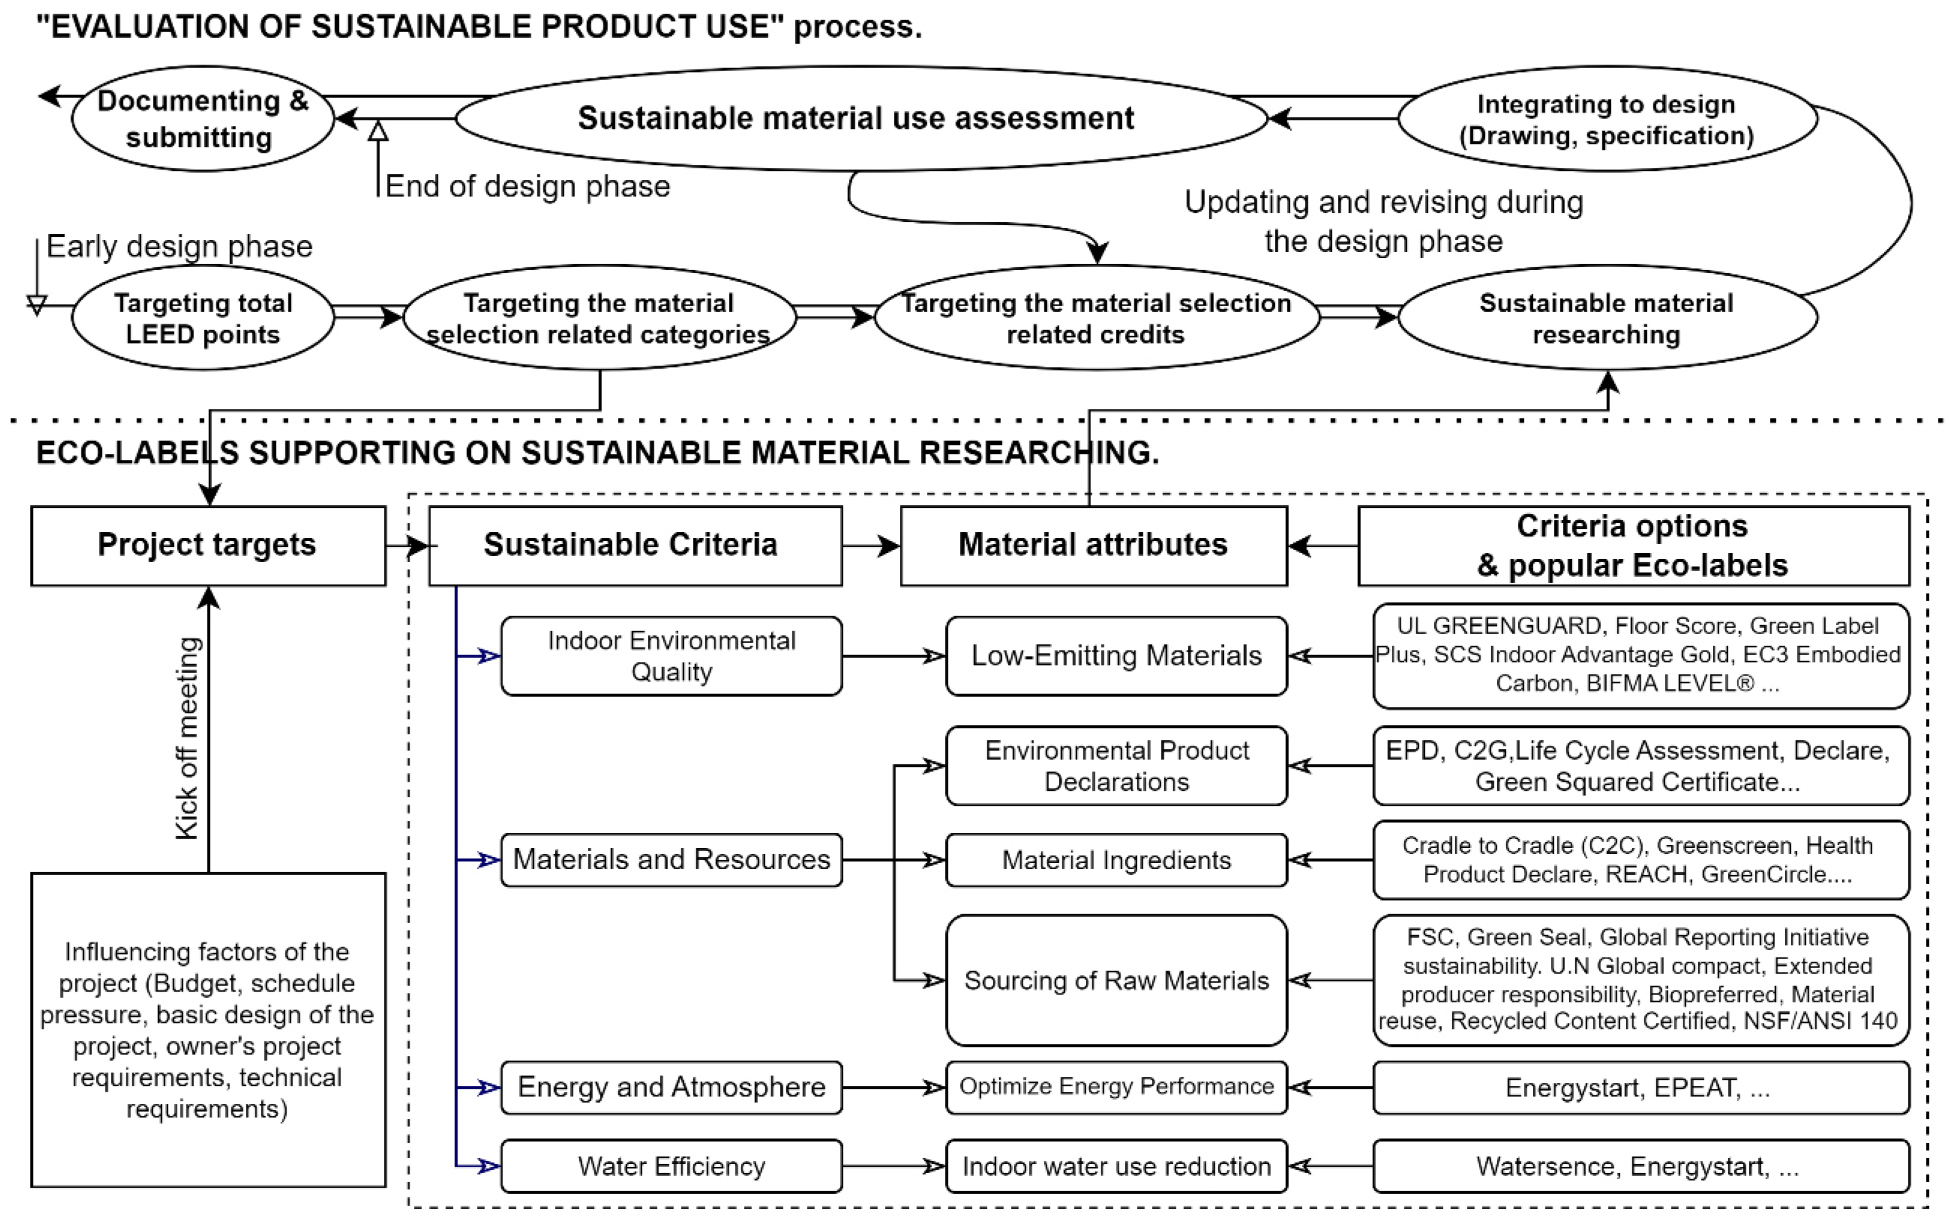
In this study, web-crawling techniques and NLP with ML were applied. Interviews with nine experts in GB consulting were conducted to identify the primary steps in sourcing and evaluating sustainable construction material design options. The selected experts, chosen for this study, each possess a minimum of 10 years of experience. They are employed at LEED consulting firms, developer companies, or the certificate authorities (GBCI). After that, the Web crawlers were developed to collect specified data on sustainable building materials (SBM). And the NLP-ML models were also trained to recognize and distinguish the sustainability properties of these materials. The data collected by the web crawlers were analyzed to the attributes of the materials. These attributes (or eco- label) were categorized based on the guidelines of the LEED standard system, which is highly recognized and shares similarities with other well-known GB standard systems. Pseudocode for this process was presented in Table 2.
Table 2.
Pseudocode for NLP-Based ML EBM Database Wrangling
Data Collecting
The study’s foundation is built upon a robust dataset of EBM amassed through web crawling and scraping. This data collection process targets diverse sources to ensure comprehensive coverage, which was recommended by the interviewed experts. Web crawlers systematically navigate these sites, following links to index pages containing EBM data. The specific databases included in this study are:
ㆍhttps://building-material-scout.com
ㆍhttps://transparencycatalog.com/
ㆍhttps://www.originmaterials.com/
ㆍhttps://www.ecomedes.com/
ㆍhttps://spot.ul.com/
ㆍhttps://www.energystar.gov/products
ㆍhttps://www.epeat.net/
ㆍhttps://www.epa.gov/watersense
Data collection from these databases involves extracting relevant information, including material names, descriptions, technical specifications, environmental certifications, manufacturer details, and any other available attributes related to sustainability, performance, and compliance. Upon identifying relevant pages, web scraping tools extract specific data elements. The data is collected in both structured (e.g., tables, databases) and unstructured (e.g., text descriptions) formats. The extracted data is then meticulously organized and stored in structured formats like CSV. This organized data serves as the input for subsequent NLP and ML analyses.
NLP Data Preparation
The raw EBM data collected through web crawling and scraping requires meticulous preparation to be suitable for subsequent NLP and ML analysis. This preparation stage involves several crucial steps that transform unstructured text into a clean and usable format.
-Data Cleaning: This step involves eliminating redundancies, such as duplicate entries, and rectifying any errors or inconsistencies present in the raw data. Missing values are handled appropriately, either by imputation or removal, depending on their extent and potential impact on analysis.
-Text Normalization: Textual data is standardized by converting all characters to lowercase, removing punctuation marks, and unifying measurement units. This step ensures consistency and eliminates variations that could hinder accurate analysis.
-Tokenization: The normalized text is then divided into smaller units, such as words or phrases, called tokens. This segmentation facilitates further processing and analysis by enabling the identification of individual semantic units within the text.
-Stop Word Removal: Common words, such as “the,” “and”, “of,” which carry little semantic meaning, are removed. This step reduces noise and focuses the analysis on more informative terms.
-Stemming/Lemmatization: Words are reduced to their base or root form. Stemming involves removing suffixes, while lemmatization considers the context to derive the dictionary form of the word. This step reduces dimensionality and groups related words together.
-Feature Extraction: The prepared text is transformed into numerical representations that machine learning models can interpret. Common techniques include bag-of-words, TF-IDF was use, and word embeddings. These representations capture semantic relationships between words and enable ML algorithms to learn patterns within the data.
These NLP data preparation steps were used to ensure that the EBM data is clean, consistent, and suitable for extracting the available eco-labels. This lays the groundwork for training robust ML models capable of extracting meaningful insights from the data and wrangling EBM databases effectively.
Training, cross-validation and selection the models
Supervised learning algorithms were examined in the study since they are commonly used for material classification tasks. Supervised learning algorithms that can be used for material classification include artificial neural networks (ANN), and support vector machines (SVM), Naive Bayes (NB), and so on [25]. Details, NB is a probabilistic algorithm that applies Bayes’ theorem with the assumption of independence between features. Despite its simplicity, NB has been effective in text classification tasks such as spam filtering and sentiment analysis [26] SVM are commonly used in text classification tasks such as sentiment analysis and spam detection, as they effectively separate different classes in feature space by finding an optimal hyperplane [27]. Decision tree algorithms offer several advantages, including effectiveness in classification, high speed, easy interpretability, and the ability to handle both classification and regression problems [28]. Random Forest is an ensemble learning algorithm that combines multiple decision trees to make predictions. It has been successfully applied to NLP classification tasks, including sentiment analysis, topic classification, and text [23]. The algorithms offer advantages such as interpretability, efficiency, and the ability to handle both categorical and numerical features [25] . However, the choice of algorithm should consider the specific requirements of the task, the characteristics of the dataset, and the desired interpretability of the model. On the other hand, the information trends of eco-labels differ due to different concepts, markets, and material objects, so this study examined 5 algorithms mentioned for training and cross-validation dataset of each eco-labels, then selected the most appropriate algorithm based on accuracy and F1 score for developing the final workflow.
Models Validation
In binary classification, classifiers’ predictive performance relies on four key statistics: TP, FN, FP, and TN. These statistics, in balanced class scenarios, enable the computation of evaluation metrics like Accuracy, P, R, and F1 [29]. However, with imbalanced class distributions, such metrics may mislead. For instance, in a dataset with 90 negatives and 10 positives, a classifier predicting only negatives would still achieve 90% accuracy, rendering it seemingly effective when it’s not. In such scenarios, it’s vital to consider both the TP rate and FP rate [30]. TP rate gauges correctly classified positives against actual positives, while FPR measures incorrectly classified negatives against true negatives. Due to the risks of skewed predictions from imbalanced data, the Receiver Operating Characteristic-Area Under the Curve (ROC-AUC) offers a robust evaluation, considering both sensitivity and specificity, and remaining consistent across varied base rates [31]. ROC graphs visually represent classifier performance through TP rate and FP rate, with the curve’s proximity to the upper left corner indicating better prediction. An ideal ROC curve sees the Area Under the ROC (AUROC) near unity, signifying impeccable classification. AUROC values categorize as: 0.9-1.0 excellent, 0.8-0.9 good, 0.7-0.8 fair, 0.6-0.7 poor, and 0.5-0.6 as failure [32]. Consequently, the combination of evaluation metrics, such as accuracy, P, R, F1 and ROC curve, provides a comprehensive and in-depth assessment of the reliability and effectiveness of the NLP model in this context. Hence, the ROC-AUC metric serves as the foundational criterion for choosing the most suitable algorithms and models for each dataset pertaining to individual eco-labels. To further validate the chosen models, metrics like Accuracy, P, R, and F1 were employed on both independent test datasets.
Results and Discussion
EBM Databases investigation and collected data
A brief green material assessment process is presented in Figure 1. According to the interviewed experts, sustainability aims, including green and net-zero building aspirations, are typically outlined in the early design stages. These goals are predicated on myriad factors such as energy efficiency, environmental implications, and the health and well-being of occupants, necessitating judicious decision-making in the project’s conception [4]. To meet these benchmarks, selected materials should exhibit distinct qualities, verifiable through eco-labels authenticated by third parties. Materials should align with set sustainability criteria, reflecting attributes like recycled content, resource renewability, reduced embodied energy, minimal VOC emissions, and proven durability [33]. A holistic approach necessitates the active involvement of a cross-section of stakeholders: from architects and designers to contractors and suppliers, each offering invaluable expertise to fortify the sustainability quotient of chosen materials [34]. These eco-labels furnish standardized insights on the environmental efficacy and sustainability features of construction materials, rendering them invaluable to architects, designers, and other decision-makers. By distilling complex data into digestible information, eco-labels streamline the decision-making workflow, offering clear insights into the environmental bona fides of materials [35]. This facilitates a comparative evaluation of materials, focusing on LEED criteria like environmental repercussions, energy conservation, among others [35]. As a databases investigation result, total of 16 eco-labels were tested in this study, including Water Sense (US EPA), Energy Star, EPEAT, Cradle to Gate (C2G), Environmental Product Declarations (EPD), Forest Stewardship Council (FSC), Cradle to Cradle (C2C), U.N Global compact, Extended producer responsibility (EPR), Bio preferred®, Material reuse, Recycled content, Greenscreen, Health Product Declare (HPD), and UL Green Guard.
From January 2021 to March 2021, extensive data collection was undertaken using developed crawlers, amassing over 300,000 initial observations. Following qualification procedures, the dataset was manually refined to 64,350 data points. A significant portion of the initial observations were removed due to duplication or a lack of essential information. These discrepancies align with concerns noted in earlier studies regarding inherent deficiencies in current databases. Such shortcomings include data duplication and information format inconsistencies, often stemming from variations in the proficiency of data-entry personnel. A collected data statistical analysis (Table 3) highlights the issues arising from the unbalanced data typical of existing databases. This imbalance underscores the emerging need for hybrid models to accurately discern material information in the future, rather than solely depending on databases. Within the databases, most sustainable construction materials are distributed among the following material groups: Building Finishes (91,291), Building Furniture (41,782), Office Electronics (35,151), HVAC/Mechanical (16,466), and Appliances (100,048). Regarding eco-label representation, dominant labels include ENERGY STAR® Certified (84,964), UL GREENGUARD (79,811), Environmental Product Declaration (EPD) (31,037), Biopreferred® (16,869), and Green Label Plus (19,383). These figures indirectly provide insights into the prevailing sustainable product market dynamics, suggesting a tilt towards premium product categories, notably within the realms of Interior and Electrical Appliances. Evaluating the eco-labels market panorama, there’s a discernible inclination towards attributes such as energy efficiency and user health protection, with diminished emphasis on pivotal sustainability facets like material origin and emissions. Grasping these market tendencies equips project teams with the requisite acumen to judiciously select suitable materials for their endeavors. The unbalance in the number of these eco-labels can lead to the problem of lack of data in training models. Thus, the special nature of the data requires caution in the process of validating the effectiveness of the NLP-ML models built in this study.
Table 3.
Number of samples collected for each eco-label and sustainable attributes
Potential of NLP based ML on Building Material Eco-Label Databases Wrangling
During the training and cross-validation of the models, analysis of the ROC-AUC scores (Details in the Figure 2) [32] for the 16 NLP-ML predictive models across various ecolabels revealed distinct performance trends. In all groups of models trained for predicting eco-labels, the majority of models suggested good model predictive performance when ROC-AUC values lie between 0.70 and 1.0 [36]. The Random Forest (RF) algorithm consistently emerged as a top-performing classifier, achieving notably high AUC scores in models such as “PBTs”, “Crate to Gate”, and the “UL GREENGUARD label”. Conversely, the performance of the SVM algorithm varied, excelling in ecolabels like “Water sense” but lagging with an AUC of 0.483 for “UN Global Compact”. Recall, and F1-score for various eco-labels as outlined in Appendix 1, there emerged two algorithms that consistently demonstrated superior outcomes. Specifically, the RF and SVM algorithms showcased remarkable reliability across the datasets.
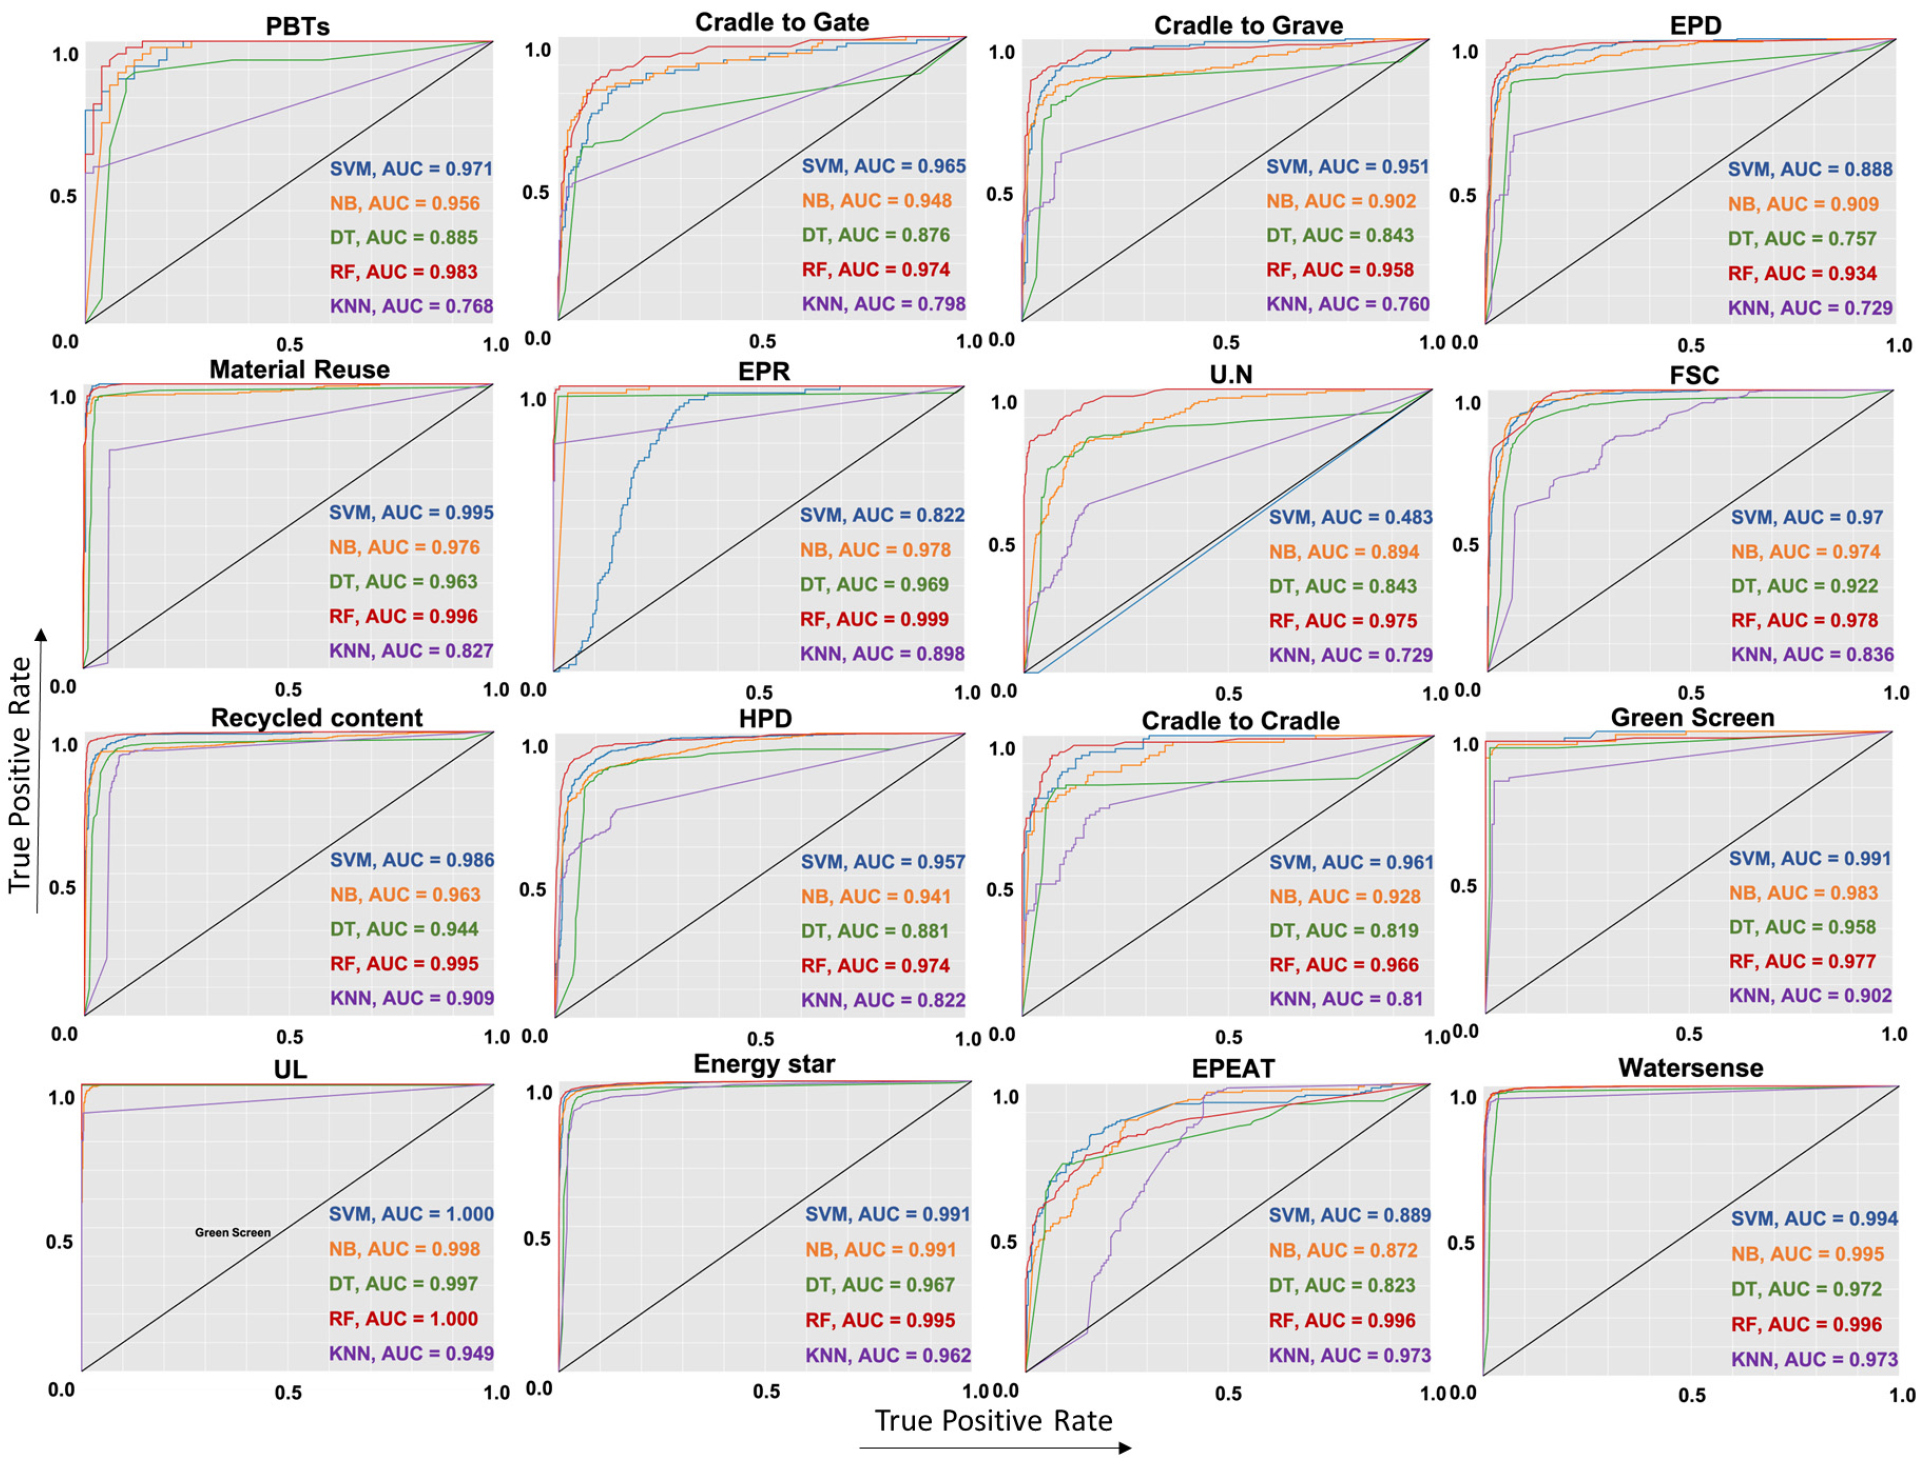
During cross-validation to select models that match the data of the lunacy eco-labels (The results are shown in Appendix 1), and the evaluation process on the test dataset. The metrics assessed encompass recall, precision, and F1-score across both cross-validation and testing datasets (See in Table 4). For many ecolabels, the RF algorithm consistently delivered commendable performance, exemplified by its F1-scores for attributes like “PBTs” (94.19% in cross-validation, 94.72% in testing) and “C2Gate” (92.78% in cross-validation, 93.25% in testing). Its capacity to yield high F1-scores suggests an adept balance of precision and recall, indicative of its proficiency in accurately identifying true cases while minimizing inaccuracies. Conversely, the SVM algorithm showcased exceptional performance for specific attributes. Notably, it achieved perfection for the “UL” ecolabel during cross- validation and reported an F1-score of 96.56% for the “WS” ecolabel in the same phase. RF has consistently exhibited robust performance across multiple attributes. The ability to achieve high F1-scores suggests that the RF algorithm can effectively balance precision and recall, making it adept at identifying true positive cases while minimizing false positives and negatives. The SVM has demonstrated exemplary performance in specific attributes. Notably, for the “UL” attribute, SVM achieved perfection in cross-validation across all performance metrics. Attributes such as “PBTs” and “C2Gate” showcased such consistency, with minor differences in F1-scores between the two datasets. This consistency is indicative of the model’s generalization capabilities, suggesting its potential applicability in real-world scenarios beyond the confines of the training dataset. Variability Among Attributes: There exists a degree of variability in performance among different attributes, even within the same algorithm. Such variability implies the intrinsic complexities and unique characteristics each attribute might present.
Table 4.
Recall, Precision and F-measure results of selected ML-NLP models on test data set
Conclusions
This study successfully applied natural language processing (NLP) and machine learning (ML) techniques to the challenge of consolidating and extracting valuable information from disparate eco-labeled building materials (EBM) databases. By automating the standardization of terminology, resolution of inconsistencies, and integration of diverse data sources, our approach offers a streamlined solution to the labor-intensive task of EBM data wrangling.
The curated dataset of 64,350 data points, compiled through investigation of EBM databases and web scraping/crawling, served as the foundation for subsequent analysis. Leveraging NLP and ML algorithms, we demonstrated the effective classification of EBM attributes across various ecolabels, with the Random Forest algorithm consistently exhibiting superior performance. Notably, high AUC scores and F1-scores for attributes like “PBTs” and “Crate to Gate” showcase the methodological efficacy in accurately categorizing EBM data.
The resulting structured EBM database may serve as a resource for stakeholders to efficiently query and analyze relevant information, thereby informing decision-making processes in the selection and utilization of sustainable building materials. By enhancing the accessibility and organization of EBM data, this research contributes to the broader efforts towards promoting sustainable construction practices within the built environment.
However, this study has some limitations. The research focused on a specific set of eco-labels and databases, which may not be exhaustive. Additionally, the performance of the ML-NLP models varied across different eco-labels, indicating the need for further refinement and optimization. Future research could explore the inclusion of additional eco-labels and databases, as well as the development of more sophisticated ML-NLP models to improve the accuracy and consistency of SBM information extraction and analysis. Furthermore, the integration of this framework with Building Information Modeling (BIM) could enhance the practical application of the findings in real-world construction projects.
