

Introduction
Literature review
Methodology
The definition of variables
Bivariate probit model
Data
Data collection and survey design
Descriptive statistics
Results
Private car
Taxi
Public transportation (Bus, Metro)
Railway (Intercity services)
Personal Mobility (including bicycle, motorcycle, PMs, walk)
Discussion and Conclusion
Introduction
Since COVID-19 was first reported in December 2019, it has spread rapidly worldwide and has had a great impact on human society, not only in public health environment but also in global economic growth [1, 2]. As of July 2021, the total number of patients worldwide reached about 200 million and the death toll reached 4.16 million. In response to the epidemic, governments have taken various measures to slow the spread of the disease and reduce the countless negative effects on society. China, for example, has implemented policies such as closing Wuhan airports and railway stations and imposing lockdown measures to control access to cities by 2020. As a result, the number of public transportation users in 36 major cities in China in 2020 decreased 33.7 percent year-on-year. Other countries also studied changes in transportation patterns caused by COVID-19, and related studies were conducted in Germany [3], Sweden [4], Greece [5], and Canada [6].
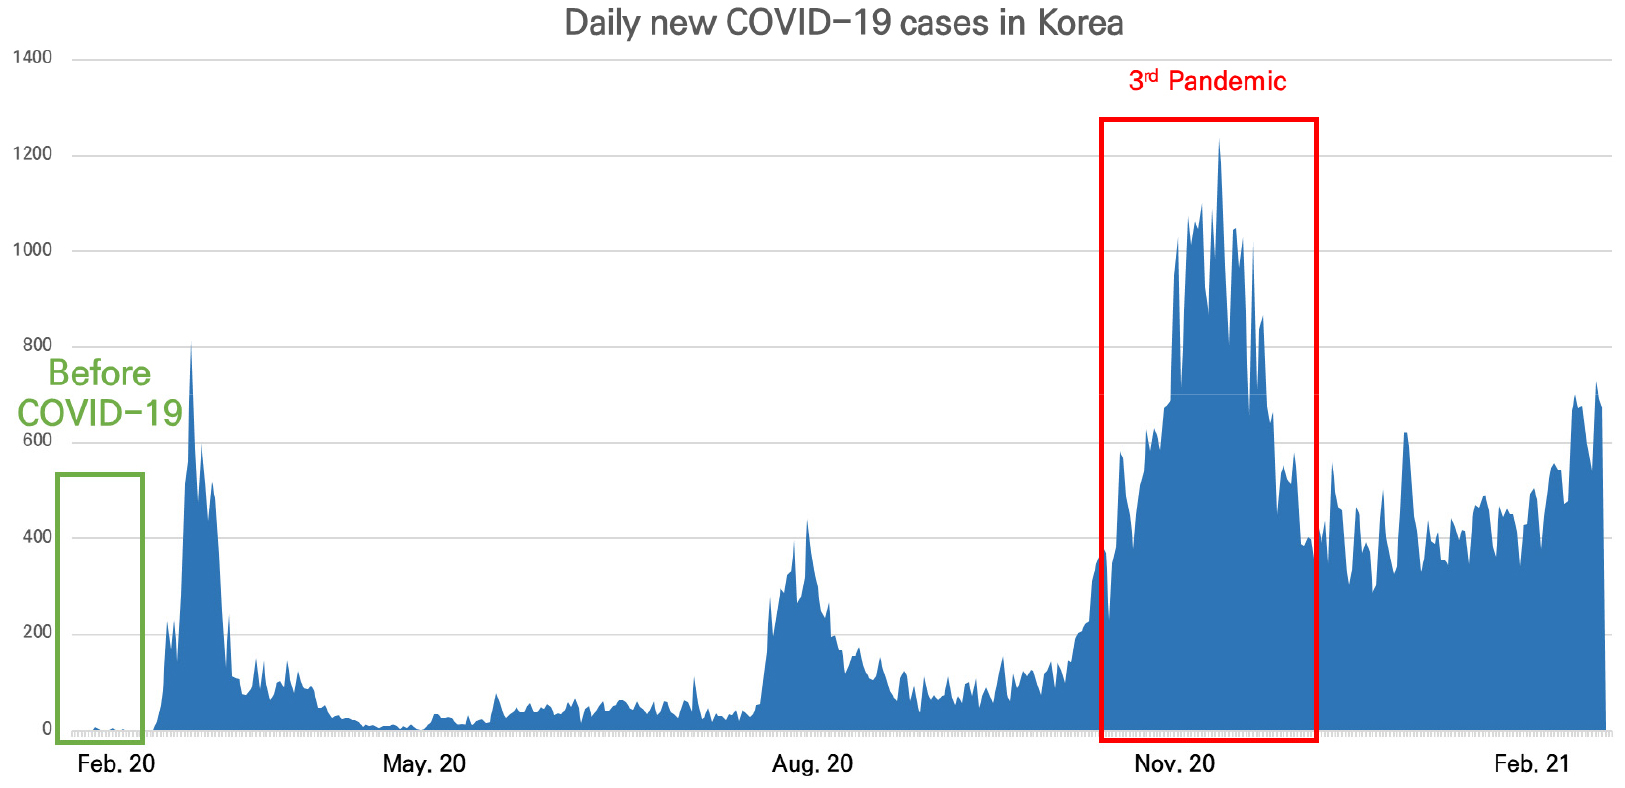
In Korea, to prevent the spread of COVID-19, business activities in Korea have been reorganized around telecommuting, and schools are operating around online classes. Many events, such as large events, local festivals, and sports events, are being canceled or held without any attendance. As a result, the number of public transportation users in Korea decreased by an average of 27%. Similarly, it was found that reductions in travel and public transport use due to the pandemic and related policy responses reduce significant heterogeneity between socioeconomic groups [7]. To understand the specific relationship between individual travel behaviors and characteristics, this study conducted a survey of individual travel behavior before and after the outbreak of COVID-19, at the peak time (the third pandemic in Korea from November 2020 to February 2021 as shown in Figure 1), and after the peak. Bivariate probit model was used to capture and explain changes in mode choice.
Literature review
Many studies have been conducted worldwide on the spread of infectious diseases and their traffic effects. Tatem et al. (2006) said that the expanding of air, sea, and land transport networks makes it possible for pathogens and their vectors to move faster [8]. Poletto et al. (2014) quantified the effect that the travel restrictions implemented by countries and airlines have on the global spread of Ebola [9]. Colizza et al. (2006) studied the role of the large scale properties of the airline transportation network in determining the global diffusion pattern of emerging diseases and evaluate the reliability of forecasts and outbreak scenarios with respect to the intrinsic stochasticity of disease transmission and traffic flows [10]. Xu et al. (2014) found that the presence of major roads, rivers and coastlines accelerated the spread of the disease and shaped its transmission patterns [11].
Immediately after the outbreak of COVID-19 in 2020, studies related to the spread of COVID-19 due to transportation facilities and traffic volume were conducted. Zhao et al. (2020) analyzed the association between modes of transportation and the spread of COVID-19 [12]. Budd & Ison (2020) analyzed the association between changes in traffic volume and the spread of COVID-19, revealing that the higher the traffic volume, the greater the risk of infection due to the number of contacts, and airplanes can reach anywhere in the world in a short amount of time at high speed, revealing that the number of air passengers plays an important role in the spread of the disease [13]. Lau et al. (2020) analysed the association between air traffic and the COVID-19 outbreak. The results show that the total number of COVID-19 cases by regions in China has a strong linear relationship with passenger volume [14]. Pequeno et al. (2020) analyzed the relationship between air traffic and the spread of COVID-19, and it is mainly related to the number of acres arriving and the population density and find that both factors increase together [15]. Sun et al. (2020) comparatively analyzed air networks before and after COVID-19 at various scales based on multi-granularity network analysis, including international airports around the world and domestic airports for representative countries/regions, and each airport We found that, on average, 50% of connections were disconnected after the outbreak of COVID-19 [16]. Mogaji, E. (2020) recognized the effect on transportation in emerging economies, where lockdowns and restrictions on movement may be ineffective, a state with high population density, poor transportation infrastructure and a large informal economy [17]. Loske (2020) analyzed the impact of COVID-19 on transport volume in retail logistics and proved that the increasing freight volume for dry products in retail logistics depend on the strength quantified through the total number of new infections per day [18].
Brough et al. (2020) analyzed travel volumes, modes, and preferences for different demographic groups during the COVID-19 pandemic, and reductions in travel and public transport use due to the pandemic and related policy responses reduce significant heterogeneity between socioeconomic groups [7]. De Vos (2020) considered the potential effects of social distancing on daily travel patterns, and especially analyzed the effects on subjective well-being and health status [19]. Zhou et al. (2020) proposed an epidemic prevention strategy for urban public transport systems according to the source, transmission route, and population of COVID-19 [20]. Shamshiripour et al. (2020) investigated an effort to investigate how and to what extent people’s mobility-styles and habitual travel behaviors have changed during the COVID-19 pandemic and to explore whether these changes will persist afterward or will bounce back to the pre-pandemic situation [21]. Parady et al. (2020) analyzes factors affecting travel behavior changes at the individual level in light of the COVID-19 pandemic in Japan, in the context of non-binding self-restriction requests and focuses on the effects of risk perception and social influence [22]. Nian et al. (2020) analyzes the relationship between COVID-19, travel of residents, Point of Interest (POI), and social activities from the perspective of taxi travel considering the impacts of epidemic and associated control policies [23]. Zhang et al. (2020) Investigated of large-scale inter-city contacts in public transport via smart card data on railroads and the number of passengers fell by 52.0% compared with the same period in 2019 [24]. Li et al. (2021) analyzes a ratio of accumulative confirmed infection cases at the city level in China on both inter-city and intra-city built environment attributes and revealed the density of point of interest around railway stations, travel time by public transport to activity centers, and the number of flights from Hubei Province are associated with the spread [25]. Lolli et al. (2020) quantitatively assessed how the meteorological and air quality parameters are correlated to the COVID-19 transmission in two large metropolitan areas in Northern Italy as Milan and Florence and in the autonomous province of Trento, and revealed that COVID-19 pandemic transmission prefers dry and cool environmental conditions, as well as polluted air [26]. Ma et al. (2021) assessed the influence of key built environment factors, which create spaces for activities on the spread of COVID-19 across townships in China at its initial stage through a random forest approach through the ratio of cumulative infection cases (RCIC), and the coefficient of variation of infection cases (CVIC) [27]. Zhang et al. (2021) analyzed the effect of travel characteristics on the spreading of disease, and determined the effect of COVID-19 on travel behavior at the individual level. As a result, public transport usage decreased by 20.5% after COVID-19, while private car usage increased by 6.4%, and this revealed that gender, occupation, and movement restrictions had a significant impact [28]. Jia et al. (2020) said that rapid and accurate tracking of aggregate population flows may therefore be epidemiologically informative and show that the distribution of population outflow from Wuhan accurately predicts the relative frequency and geographical distribution of infections with severe acute respiratory syndrome coronavirus 2 across mainland China [29]. Cui et al. (2021) employ a multi-sectoral computable general equilibrium model of China, CHINAGEM, with highly disaggregated transport sectors to examine the impacts of the COVID-19 pandemic on China’s transport sectors and reveal the impact mechanisms of the pandemic shocks with the decomposition analysis approach [30]. de Haas et al. (2020) presents insights in current and potential future effects of the virus and the Dutch government’s ‘intelligent lockdown’ on people’s activities and travel behavior and shows that the coronavirus crisis might result in structural behavioral changes [31]. Goenaga et al. (2021) assessed the impact of closures related to the pandemic on traffic patterns for the state of North Carolina and the Commonwealth of Virginia [32].
Previous studies have shown that many studies related to the epidemic have been conducted before and after the spread of COVID-19, and the spread of infectious diseases is related to traffic. In addition, previous studies analyzed the influence of the spread of infectious diseases according to the transportation modes, and it was found that the selection of transportation modes due to the spread of infectious diseases was affected. Referring to previous studies, this study intends to find what factors affect the transportation modes due to COVID-19.
Methodology
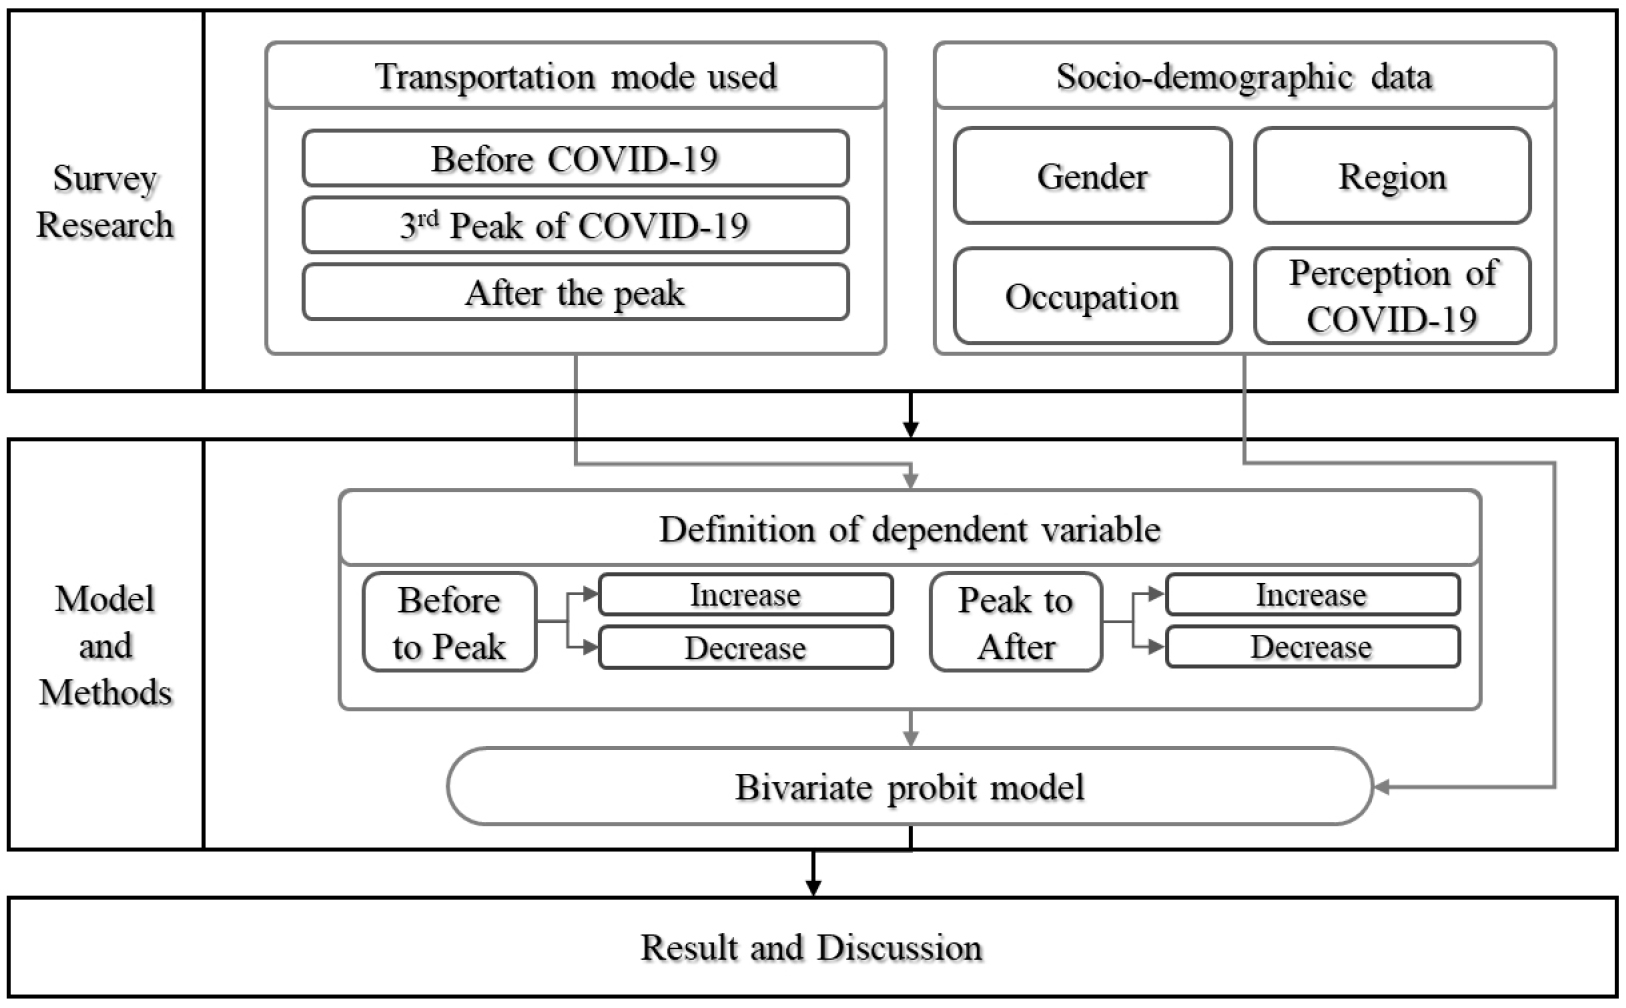
Having confirmed that COVID-19 has a significant impact on people’s travel behavior patterns, discrete choice models analyze the specific impact of individual characteristics on travel mode choices. The discrete choice model is built on the preference of decision-makers, and the utility of each choice is estimated according to the characteristic variables observed in regression analysis, resulting in better utility choices being predicted. In this study, bivariate probit model was used among various discrete choice models. Based on the coefficient derived through this model, the influencing factors of each transportation modes were derived. By organizing the results, it is possible to find out what important factors are in determining the transportation modes. The flowchart that shows the process of analysis is presented in Figure 2 below.
The definition of variables
The dependent variables are processed to be binary in Table 1. The dependent variables are defined to represent changes in the weekly usage proportion of multiple modes. Respondents’ personal characteristics were considered as independent variables, including gender, age, occupation, private vehicle ownership and residence.
Table 1
Definition of dependent variable in binary choice model by categories
Bivariate probit model
The observed individual choices related to travel behavior can be interpreted by a random utility model, revealing which choice between the two provides the better utility. The equation of the random utility model is as follows in Equation (1),
where is a vector of independent variables of respondents’ socio-demographic characteristics, 𝛽 is a vector of weight corresponding to represents the unobserved stochastic errors that derive from individual preference, and is a latent variable reflecting the utility of a specific choice. It is assumed that has a standard distribution in probit model. The outcome is calculated by the following Equation (2),
Probit model can be described as follows (Equation (3)) after normalization,
A closer inspection of the two response variables reveals that both similarly captured respondents’ travel behavior changes towards pandemic severity. Therefore, the determinants of the captured changes may be affected by shared unobserved variations, resulting in significantly correlated errors (also called disturbances) in the separate estimation of these two dependent variables. Such systematic unobserved variations are contained in the dependent variables considered. Bivariate probit model is employed for modeling the joint determination of the two binary response variables subjected to the shared unobserved characteristics. As a natural extension of the probit model, Bivariate probit model allows two equations in the same form as the seemingly unrelated regressions model, which is defined as Equation (4)
Data
Data collection and survey design
To investigate the impact of Korean residents on their travel behavior, the survey was prepared and distributed during the period of COVID-19. The data used in this paper was collected on May 1st-14st, 2021. The responses were collected from 734 individuals in Korea. The trend of new confirmed cases in Korea is presented in Figure 1. To compare how the respondents have changed travel behavior in different stages of the pandemic, three periods were set up based on the number of new confirmed cases, namely (1) before the outbreak; (2) the 3rd peak and (3) after the peak.
The survey was designed into two steps for the purpose of this study. The first step tried to find the socio-demographic characteristics of respondents. And the second step was structured to reveal the dynamics of travel behavior, including travel frequency and mode choice in the three periods (before the outbreak, the 3rd peak, after the peak). Among them, the survey of travel frequency is realized by asking the number of trips per week. And the survey on mode choice was conducted by asking how many trips were made per week using various modes of transport.
Descriptive statistics
Due to the prevalence of COVID-19 and the wide range of surveys, the questionnaire was conducted online using an online questionnaire platform. The respondents’ basic information on this online survey is summarized in Table 2. Table 2 shows that 361 respondents were male and 373 were female, accounting for 49.2 percent and 50.8 percent, respectively. By region of the capital area (Seoul, Incheon, Gyeonggi) accounted for 65.3% of the total with 479, while the Yeongnam area (Busan, Daegu, Ulsan, Gyeongnam, and Gyeongbuk) accounted for 19.3% with 142. In terms of educational background, 528 or higher university students accounted for 71.9% of the total, and the average monthly income was between 15 million won and 4.5 million won, in order of proportion of households. Office workers accounted for 45.9 percent, followed by students with 19.6 percent.
According to the results of the survey, 226 respondents thought the pandemic was very serious, accounting for 30.8 percent, and 345 respondents thought it was serious, accounting for 47.0 percent. 7% of those thought the epidemic was not serious or at all serious. The survey also collected the changes in the workplace of the respondents. In addition, 224 respondents (30.5%) said they experienced telecommuting or unpaid leave, dismissal, or closure due to COVID-19.
In addition, it has been confirmed that there is a large difference between each mode of transportation that is considered safer due to the spread of COVID-19. There were 598 respondents who thought that private cars were safe, and about 200 people said that bicycles, PMs, and walking were safe. On the other hand, fewer than 50 respondents answered that buses, metros, and railways such as KTX, which are public transportation used by unspecified people, are safe.
Changes in transportation mode have also been shown to be affected by COVID-19. For private cars, there is little difference in the number of users before and after the occurrence of COVID-19, but for taxis, it decreased by 35.2% from 256 to 166. Buses, metros, and railways, which correspond to public transportation, also declined significantly to 21.9%, 28.4%, and 53.9%, respectively. On the other hand, bicycles, motorcycles, PMs, and pedestrians, which can be seen as personal means of transportation, have remained unchanged or have decreased slightly to less than 10%.
Table 2
Socio-demographic characteristics of the sample
Results
Private car
The results of models based on various socio-demographic characteristics for private car is summarized in Table 3. Private car use increased as imports increased when COVID-19 spread, and private car use also increased when it took 10 to 20 minutes to get to the metro. And the higher the preference for public transportation, the lower the usage of private cars. On the other hand, when the spread of COVID-19 decreases the use of private cars from bachelor decreased, and those who thought railways were safe decreased. In addition, the greater the willingness to use public transportation, the lower the use of private cars. In the bivariate probit regression model, the use of private cars by office workers, self-employed businesses and retirees increased after the spread of COVID-19. On the other hand, the use of private cars has decreased if they work from home, are fired, or are closed. It was also shown that the more frequent the movement, the less private car use.
Table 3
Estimate results of usage proportion of private car
Taxi
The results of models for taxi is summarized in Table 4. The use of taxis decreased when a person was a bachelor or owned a PM during the spread of COVID-19. But the number of people who take 5 to 10 minutes to the metro increased. On the other hand, when COVID-19 calmed down, taxi use by PM owners increased, and taxi use decreased by those who took 5 to 10 minutes to get to the metro. In addition, the safer public transportation is, the fewer taxis are used. In the bivariate probit model, taxi use increased before the maximum prevalence of unemployed people’s COVID-19. PM owners also showed a pattern of increasing and decreasing taxi use with the spread of COVID-19. And those who think public transportation is safe to have seen fewer taxi use since COVID-19 calmed down.
Table 4.
Estimate results of usage proportion of taxi
Public transportation (Bus, Metro)
The results of models for public transportation is summarized in Table 5. The prevalence of COVID-19 reduced the use of public transportation by those who were temporarily dismissal or closed. However, the greater the preference or willingness to use public transportation, the greater the use of public transportation. On the other hand, when COVID-19 was sedated, the use of public transportation decreased for self-employed people or those who thought taxis were safe. On the other hand, it has been confirmed that the higher the number of weekly movements, the higher the use of public transportation. In the bivariate probe model, the prevalence of covid-19 resulted in a decrease in the use of public transportation by office workers and non-office workers, which resulted in changes in telecommuting or work patterns. It also showed that people who own private cars, bicycles and motorcycles have decreased their use of public transportation
Table 5.
Estimate results of usage proportion of public transportation (bus, metro)
Railway (Intercity services)
The results of models for railway is summarized in Table 6. During the spread of COVID-19, railway use was reduced by those who graduated from graduate school or who were terminated or out of business. On the other hand, when COVID-19 was reduced, railway use increased by those who were temporarily laid off or closed. And the number of people who take 30 to 60 minutes to get to the station decreased. Also, the use of railways increased by people who thought they were safe, and the greater the threat to corona, the less the use of railways decreased. In the bivariate probe model, railway use was reduced by people whose work patterns changed due to COVID-19. Motorcycle owners could also see an increase in railway use.
Table 6.
Estimate results of usage proportion of railway
Personal Mobility (including bicycle, motorcycle, PMs, walk)
The results of models for personal mobility including bicycle, motorcycle, PMs, walk is summarized in Table 7. During the spread of COVID-19, the use of people with a monthly income of more than 7.5 million won was reduced. However, it took 20 to 30 minutes to get to the bus stop or increased use by people who thought trains and bicycles were safe. On the other hand, when COVID-19 calmed down, the use of people who thought PM was safely decreased and the use of personal transportation increased as the number of movements increased. It was also confirmed that the preference for public transportation increased the use. Also, people who previously owned bicycles perceive bicycles as safe mode of transportation.
Table 7.
Estimate results of usage proportion of railway
Discussion and Conclusion
The spread of COVID-19 and restrictions on movement have had unprecedented effects on social activities around the world. As a result, there has been a significant change in traffic patterns and individual movement patterns. However, it is still necessary to understand the relationship between the specific direction of this change and the change in personal characteristics. Therefore, this study identified the trend of behavioral changes due to the spread of COVID-19 in Korea and established a model in relation to the choice of means of passage to confirm the impact of individual socio-demographic characteristics.
In Korea, descriptive statistics shows that there was a big change in the frequency of each transportation due to COVID-19. There was no difference in the frequency of use of private cars before and after the outbreak of COVID-19, but taxis for public transportation by unspecified people decreased by 35.2%, 21.9%, Metro 28.4%, and 53.9% by rail 53.9%. On the other hand, Bicycles, Motorcycles, PMS and Pedestrians were reduced or less than 10%. In addition, after the end of the third pandemic, there was no increase in the use of each transportation method. It is believed that the spread of COVID-19 is dangerous because there are surging new patients every day even after the end of the third pandemic, and there are holidays such as Children’s Day and the Day of Buddha’s Coming in May.
The following results were obtained in relation to the change in traffic behavior for each mode of transportation: First, behavior changes were different depending on the type of work and working conditions. In the case of telecommuting, the use of public transportation decreased, and in the case of dismissal, closure, or closure, the use of private cars decreased significantly. About two-thirds of the survey respondents live in the Seoul metropolitan area, and it seems that the decrease in public transportation use by office workers was noticeable due to the characteristics of the highly developed in Seoul. Other significant decreases in the use of private cars are likely to include the purpose of reducing expenditures such as vehicle maintenance costs. Second, individuals’ preference for public transportation also affected the choice of transportation during the period of the spread of COVID-19. The preference for transportation depends on preference for public transportation, willingness to use public transportation, and individual support for the safety of public transportation. In this regard, it would have been difficult to change the means of transportation previously used, or it would have been affected to think that it would not be infected with COVID-19 by complying with personal quarantine such as masks.
Although this study identified changes in behavior by means of transportation, there are many limitations. First, although the number of respondents was 700, local deviations were significant and local analysis was not performed. Second, the survey was conducted on the third pandemic period, resulting in different aspects from other overseas studies. Third, surveys may only be conducted online so that the data do not fully represent the general population. And, this study only considered the result of the survey, not the travel data. The result of the study could be more persuasive if the actual travel data also collected and utilized at this study. Future study could find the change in actual usage of the transportation by collecting the data, such as traffic card usage, highway traffic, monthly public bicycle users, foot traffic, etc. Subsequent research will need to be undertaken to supplement these restrictions.
