Introduction
Development of an engineer model for natural carbonation
Natural carbonation
Calculation of accelerated carbonation
Impact of temperature on natural carbonation
Impact of relative humidity on natural carbonation
Impact of curing at reference temperature and relative humidity
Impact of curing at different temperature and relative humidity
Impact of variable T° and RH during carbonation
Impact of rain in unsheltered condition
Calibration of the model
Source and type of data
Calibration strategy
Calibration of the accelerated carbonation model
Calibration of the model for sheltered condition
Calibration of the model for unsheltered condition
Validation of the model prediction results
Source of data
Controlled carbonation
Indoor and sheltered carbonation
Unsheltered carbonation
Discussion
Model
Curing
Effect of rain: sheltered vs unsheltered conditions
Future development
Conclusions
Introduction
Corrosion induced by carbonation is one of the main durability issues limiting the service life of reinforced concrete structures. To counteract corrosion risk due to carbonation, concretes are customarily designed to fulfill certain requirement on carbonation resistance depending on the aggressiveness of the environment to which they are exposed. The resistance of concrete to carbonation is often evaluated using accelerated carbonation test according to various standards [1, 2, 3]. Natural carbonation can be then estimated using a constant empirical conversion coefficient as proposed in Swiss standard [3]. Another method aiming at evaluating directly the resistance of concrete to natural carbonation in controlled laboratory conditions can also be used [4]. However, these approaches see quickly their limit as the climatic conditions are strongly varying from one region to others in reality and they are unlikely to impact on the carbonation in the same way. As a consequence, the fact of considering either a constant conversion coefficient or laboratory controlled conditions cannot be generalized to real exposure. Together with the ongoing implementation of the Performance Based Specifications (PBS) approach for durability in various countries [5], it is important to be able to evaluate the carbonation resistance of concrete linked with the real exposure conditions in order to estimate the service life of structures.
In this context, many models, empirical [6, 7, 8, 9, 10, 11, 12, 13, 14, 15, 16, 17, 18, 19], numerical [20, 21, 22, 23, 24, 25, 26] and machine learning-based [27, 28], have been proposed to predict the carbonation of concrete. However, the application of these models to real structures remains quite limited because numerical models require very complete and accurate input data which cannot be provided in reality while the cited empirical and machine learning-based models do not take into account satisfactorily the impact of the main influencing factors as concrete mix-design, curing period and exposure conditions (i.e. temperature (T°), relative humidity (RH) and rain) at the same time.
Among the influencing factors mentioned above, the impact of rain is of high significance as reported by many researches [29, 30, 31, 32, 33, 34, 35]. For unsheltered structural elements exposed to rain, the CO2 ingress into concrete is intermittent as a result of repeated wetting/drying periods. During wetting periods, right after rain events, concrete surface remains saturated that block temporarily the diffusion of CO2 into concrete. In general, the degree of impact of rain depends strongly on the climates [35]. To take into account this, only fib Model Code [13] actually proposes a weather function which can be theoretically generalized to different climates. However, this weather function doesn’t seem to match with data from [35].
In this work, an engineer model using concrete mix-design, curing period and climatic conditions (T°, RH and rain) as input parameters was proposed for predicting the natural carbonation. The model was developed based on a model for accelerated carbonation prior developed at Holcim Innovation Center (HIC) as natural and accelerated carbonations can be linked to each other via a correction factor [3, 13, 16, 36] depending on the climatic conditions. In the model, it was shown that, despite a great fluctuation of T° and RH over time, the use of their average annual value is sufficient. Especially, the impact of wetting periods due to rain was considered in the model simply as an additional fluctuation of RH modifying its average annual value. The model was first calibrated and validated on data coming from five different climates [35]: Lyon (France), Chennai (India), Austin (US), Fredericton (Canada) and Changsha (China). Its validity was then verified for various other data collected in the literature for different climates.
Development of an engineer model for natural carbonation
Natural carbonation
In 1958, Verbeck [6] mentioned that concrete carbonation rate was related to water and carbon dioxide mass transfer. The carbonation depth at any exposure time in natural exposure conditions and the square root of time have been proven to be proportional [7, 8] (see eq (1), where denotes the natural carbonation rate with a common practical unit of [mm/y^0.5]). Parrott in his review [29] mentioned some deviation from the square root of time at early age: to predict carbonation depth affine functions of square root of time and also other value of the time exponent have been proposed.
Also, the square root of time behavior can be derived from the 1st Fick’s law and a carbonation reaction at the carbonation front, as proposed by Klopfer [9] when material properties are constant with space and time. Therefore in this work, the carbonation rate is chosen as proportional to the square root of time. The carbonation rate depends in general on the concrete mix-design (e.g. cement type and dosage, water to cement ratio), the curing period before exposure and the climatic conditions.
Several works have suggested a linear relationship between accelerated and natural carbonation [3, 13, 16, 36]. In order to link natural carbonation in sheltered condition protected from rain to accelerated carbonation, the same modeling strategy as in these works was used (eq (2)), where is the natural carbonation rate of concrete exposed at days of curing, is the accelerated carbonation rate of concrete exposed at 28 days of curing at 1% CO2 content and at reference temperature and relative humidity, is the atmospheric CO2 content at exposure location (in %), is a function taking into account the effect of exposure temperature, is a function taking into account the effect of exposure relative humidity, is a function taking into account the impact of curing () before exposure and 𝜃 a correction factor for accelerated carbonation. Different parameters and functions will be revisited and detailed further in the next sections.
The parameter 𝜃 is related to the fact that in accelerated test the drying front does not penetrate as deep as it does in natural exposure due to shorter exposure period [13] in spite of the higher CO2 concentration. Indeed, the carbonation process is not as much accelerated as the theory suggests with the square root of the CO2 concentration ratio (accelerated to atmospheric concentrations).This offset is related to the fact in accelerated conditions only the CO2 mass transfer is accelerated and not the water mass transfer, which leads to the accumulation of water at the carbonation front and lowers the global carbonation rate [22, 23, 28]. The parameter can be either experimentally determined via accelerated test described in [1] or estimated using model. In order to propose a fully predictive model for natural carbonation, this parameter is estimated using a model described below.
Calculation of accelerated carbonation
The accelerated carbonation depth at exposure time can be computed according to equation as suggested in [24], where is the molar CO2 content, the effective diffusion coefficient of CO2 and the molar content of portlandite.
As the temperature and relative humidity are fixed (T=20°C and RH=65%) during accelerated test [1], assuming that the term depends only on the concrete mix-design (eq (4)), the equation (5) was proposed to calculate the carbonation rate, where is the effective water (l/m3 of concrete), , are the mass of clinker and Supplementary Cementing Material (kg/m3 of concrete), is the molar CO2 content in gas and is the CO2 content in percent and , 𝛽, are fitting parameters to be calibrated. There are as many values as number of SCMs used.
Impact of temperature on natural carbonation
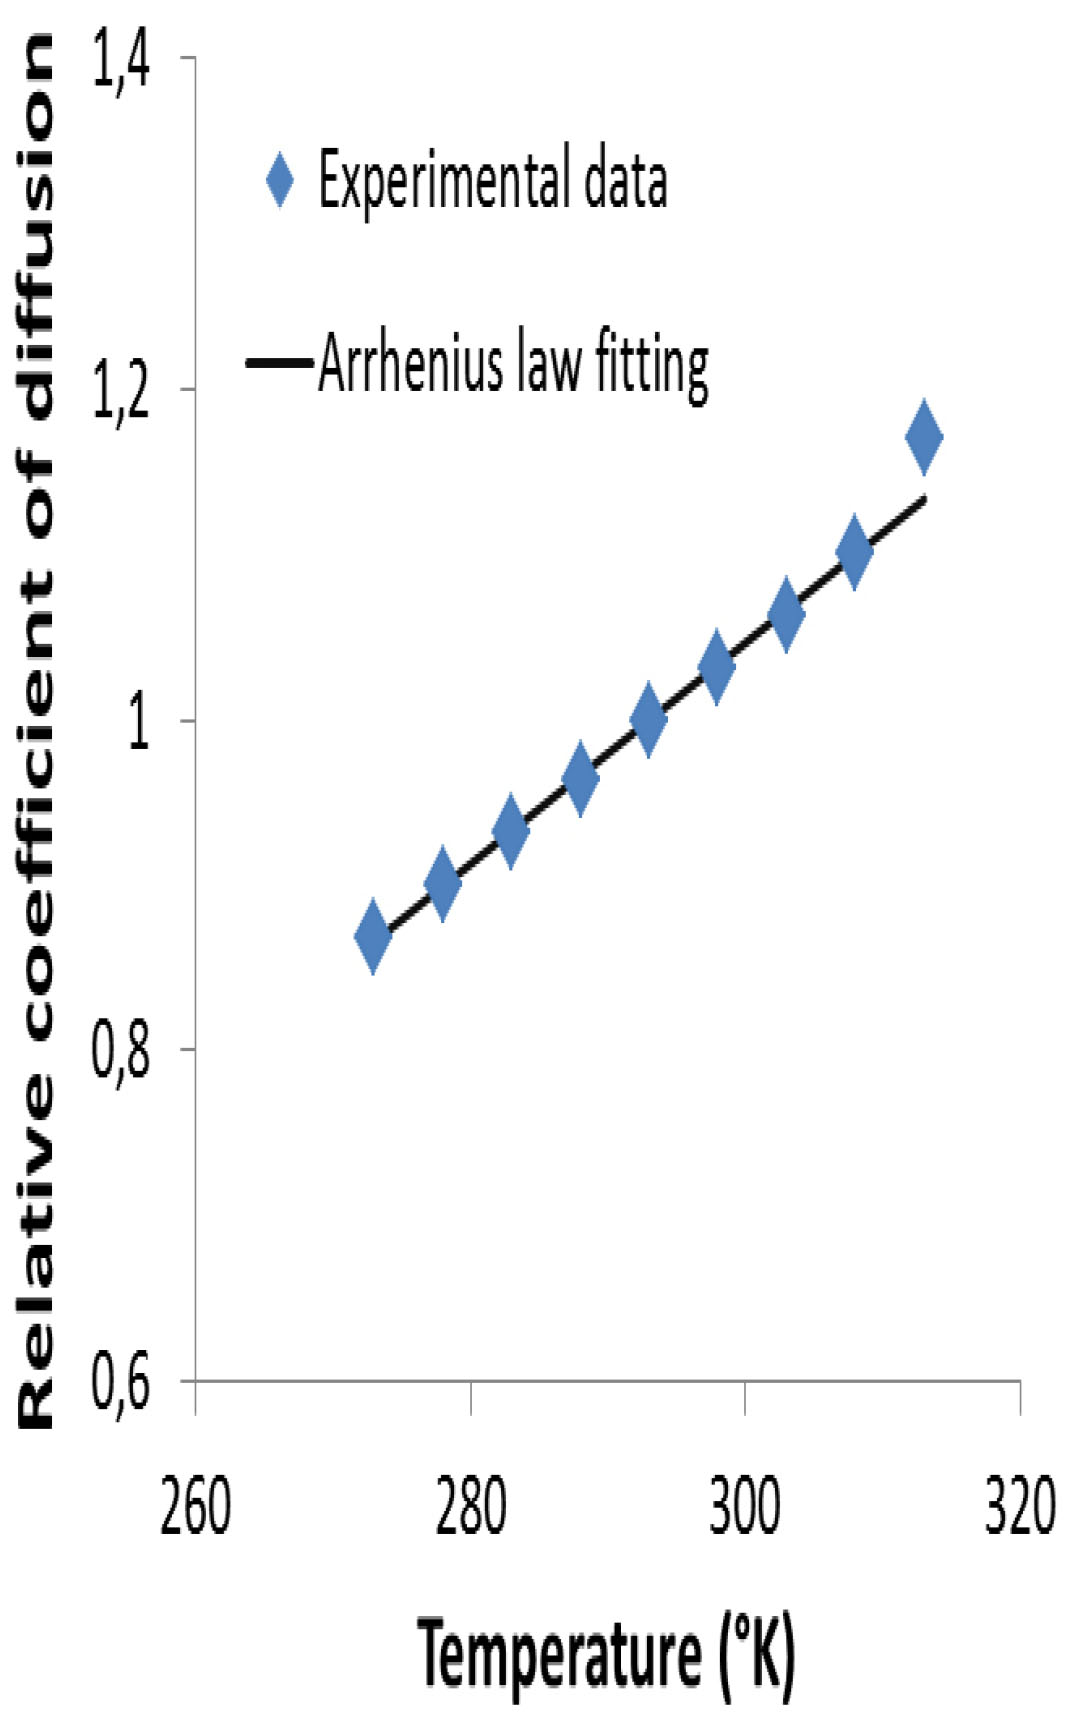
The impact of temperature on the carbonation rate can be described using Arrhenius’ law (eq (6)) as suggested by [14] where and , are respectively the exposure and reference temperature (in °K) and , a constant. As the accelerated test is performed at 20°C, . Note that A is an activation energy divided by R, the ideal gas constant. For the constant , Talukdar [14] has taken the value of , which is consistent with an activation energy of ~40 kJ/mol (the same range as for Portland cement hydration). Assuming that the impact of temperature on carbonation ingress relies essentially on changing the coefficient of diffusion of CO2, this constant was calibrated from experimental data provided by [37] that gives an A value of . The calibration of A is detailed in the Appendix Figure 1. The huge difference between the two values of A can be explained by the fact that the cement hydration and the CO2 diffusion are two processes totally different whose activation energy is not necessarily in the same range.
Impact of relative humidity on natural carbonation
Following several works [10, 12, 15], the coefficient of diffusion of CO2 can be linked to the relative humidity according to eq (7) where 𝜒 is a parameter depending on the mix-design of concrete, and are two parameters calibrated from experimental data. The values of and used by different authors are summarized in the Table 1. Agreement was not found between the authors. It was decided in this study to set the value to 0. Therefore, the function taking into account the impact of relative humidity is written according to eq (8). The parameter needs to be calibrated from experimental data and is the reference relative humidity in accelerated test (=65%).
Table 1.
Value of a and b used by different authors
| Author | a | b |
| Papadakis [10] | 2.2 | 0 |
| Jiang [12] | 0.6 | 0 |
| Salvoldi [15] | 2 | 2.6 |
Impact of curing at reference temperature and relative humidity
Balayssac’s results [38] obtained on concretes with limestone cement show a very large impact of the curing period on the natural carbonation (Figure 1). In their study, the natural carbonation test was performed in controlled lab at 300 ppm CO2, 20°C and 60% RH.
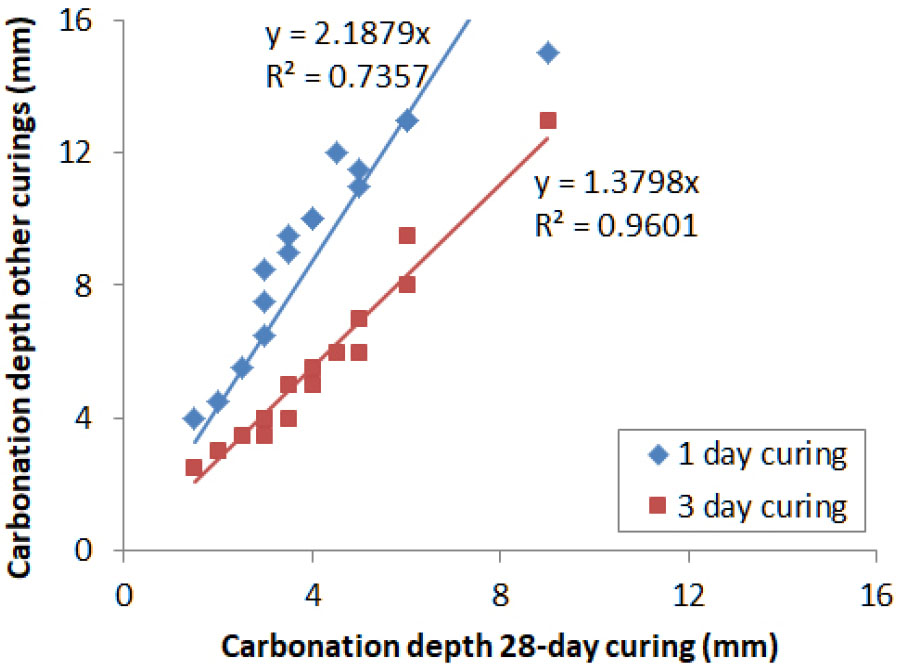
It can be seen in Figure 1 that the carbonation depth is quite linear between different curing periods, regardless of the exposure age from 90 to 540 days. The carbonation depth for 1 day curing is more than twice greater than that for 28 day curing. This ratio is however much reduced between 3 and 28 days of curing. This means that over 3 days, the impact of curing should start stabilizing. In addition, Vu et al. [35] showed that the impact of curing can be neglected for curing period over 14 days, regardless of the type of binders. Based on these results, it was proposed to model the impact of curing using an asymptotic function shape (see eq (9), (11)), where is the natural carbonation rate for a given curing age and is the natural carbonation rate for 28 day curing.
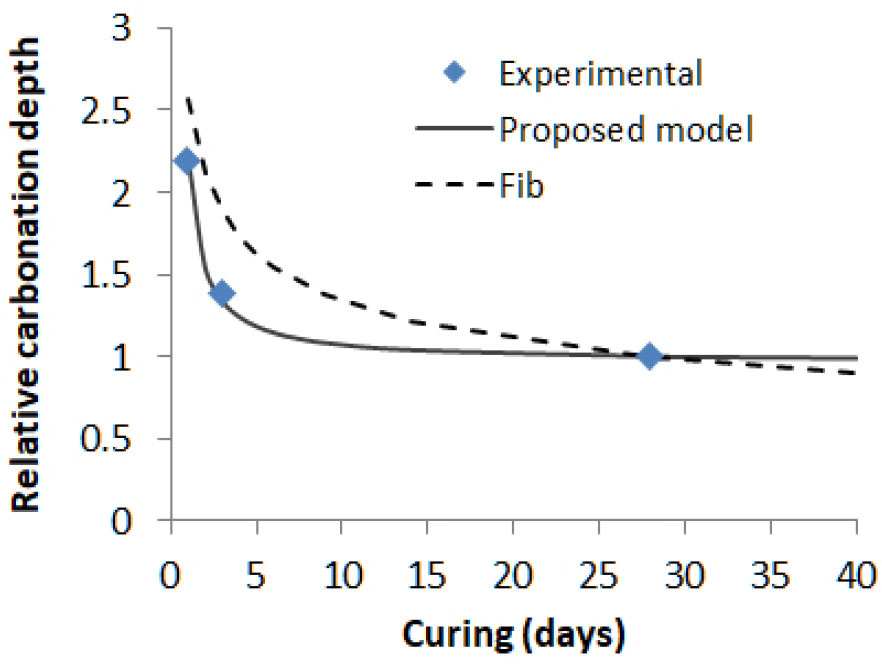
Developed from the execution transfer parameter related to the curing period in fib Model Code [13], the natural carbonation rate for a given curing age is linked to the natural carbonation rate for 28 day curing according to eq (10). The impact of curing as proposed in eq (11) is compared with experimental result [38] and fib Model Code in Figure 2. It can be seen that the difference between 3 and 28 day curing is much greater in fib Model Code than in experimental result. In addition, the impact of curing in Fib Model Code is not reaching a plateau beyond 28 days of curing whereas experimental data [35] confirms that curing beyond 28 days has no effect on carbonation depth.
Impact of curing at different temperature and relative humidity
It is important to note that the ratio of 1 day curing to 28 day curing carbonation depth found by Vu et al. [35] is much lower than that in Balayssac’s results (Figure 3). In [35], concretes were placed in a Stevenson shelter, i.e. in a testing platform where sample are sheltered from rain and where the annual average T° and RH were about 13°C and 69%, respectively, whereas in [38] the constant T° and RH were 20°C and 60%, respectively. These results clearly suggest the curing dependence of carbonation does also depend on temperature and relative humidity during the curing period.
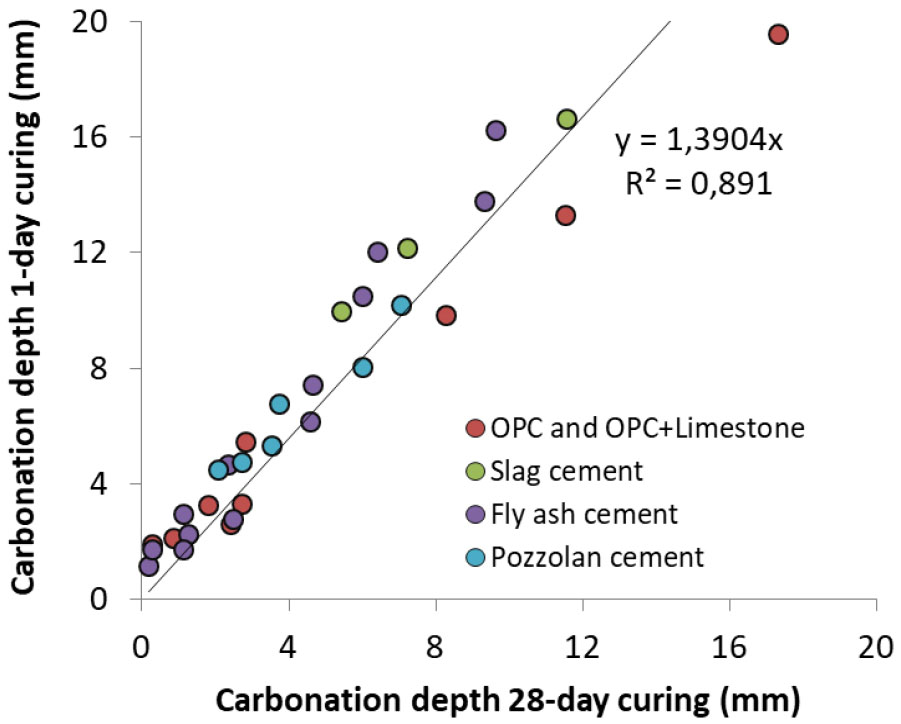
Figure 3.
Impact of curing on carbonation in sheltered condition at varying T° and RH: carbonation depth for 1 day curing as a function of carbonation depth for28 day curing [35].
To explain the large difference between both results above, it’s worth noting that for early curing cement continues to hydrate during exposure such that a higher degree of hydration should be accounted for with respect to the reference curing. This additional hydration depends on the exposure conditions (i.e. T° and RH) and contributes to reducing the difference in carbonation rate between 1 and 28 day curing [35]. Therefore, in the case where T° and RH are different from that in Balayssac’s test, in order to keep the eq (10) valid, the initial curing (either wet or sealed curing) should be modified.
To estimate the additional hydration, one can rely on the notion of “equivalent curing”. The equivalent curing age at a given temperature and relative humidity can be estimated as suggested by Bazant [39] with a temperature () and relative humidity () activation terms (see eq (12)), where is the equivalent curing increment if cured at reference condition ( and ), curing increment in real condition.
Acknowledging that the curing age in eq (9) needs to be modified only for as additional hydration would take place compared with Balayssac’s reference condition, we propose to evaluate an equivalent curing time according to eq (13), where the initial curing and 𝜆 a calibrating parameter taking into account the additional curing during exposure. The eq (13) is derived from eq (12) assuming constant temperature and relative humidity.
The temperature activation term corresponds to the well-known Arrhenius equation (15), where is the activation energy for the hydration process and is the ideal gas constant and the relative humidity activation term follows the one proposed by Bazant, normalized by the reference conditions (eq (16)). The value is close to 1 at 100% RH, 0.1 at 78% RH and 0 at the reference RH of 60% highlighting the strong contribution of RH on equivalent curing. The reference temperature and relative humidity are and .
Note that if concrete is not cured at reference temperature (T=20°C) before exposure, the initial curing can be modified according to eq (17) where is the average external temperature during the initial curing and the initial curing at this temperature.
Impact of variable T° and RH during carbonation
The equations (2) to (16) allow the estimation of natural carbonation for constant exposure conditions (CO2 content, T° and RH). However, in field exposure, these parameters can fluctuate strongly as shown in [35]. In this case, it is important to specify which type of climatic data basis (daily, monthly or annual) can be used for both practical aspect and accuracy of the model. Since the CO2 content in the field is not always available and is often measured only during short periods, the average value over available measuring periods can be used. Therefore, only the impact of the fluctuation of T° and RH was studied as data can be more easily accessed.
Let 𝜑 (eq (18)) denote the coefficient taking into account the combined average contribution of the T° and RH activation term over 1 year by combining the equations (16) and (17). φ was computed for Lyon on 200 periods of 1 year, taken randomly from 2011 to 2016. It is found that the proposed model is not sensitive to the fluctuation of T° and RH for ranged within [0.6-2.2]. In using daily, monthly or annual data, the maximum difference does not exceed 5% (Table 2). Therefore, annual average value will be used for both T° and RH in the model. Given the possible large variation of these parameters from one year to others, it is recommended to calculate the annual average value over a long period for better prediction accuracy.
For the sake of simplicity, the annual average value of T° and RH is also used in eq (15) and eq (16) to evaluate the additional curing during exposure.
Table 2.
Values of coefficient 𝜑 taking into account the combined effect of T° and RH over 1 year depending on the type of data basis
| a=2.2 | a=0.6 | |||||
| RH daily | RH monthly | RH annual | RH daily | RH monthly | RH annual | |
| T° daily | 0.76 | 0.75 | 0.73 | 0.86 | 0.87 | 0.88 |
| T° monthly | 0.76 | 0.78 | 0.71 | 0.86 | 0.87 | 0.88 |
| T° annual | 0.75 | 0.76 | 0.71 | 0.85 | 0.88 | 0.89 |
Impact of rain in unsheltered condition
Although climatic conditions as T° and RH fluctuate strongly, it was shown previously that the use of their annual average value is sufficiently accurate for the proposed model. In assuming that the impact of rain relies mainly on saturating concrete surface that modifies the external RH seen by concrete during certain time duration before the RH equilibrium between concrete surface and environment is established, each wetting period can be thus considered as an additional fluctuation to the external RH. The idea was to take into account this additional fluctuation in the calculation of annual average RH.
If the surface of concrete is saturated by rain, the external RH can be considered to be equal to 100%. Assuming that a daily amount of rain over 2.5 mm is needed to saturate the concrete surface (value inspired from fib Model Code [13]), the equivalent annual RH taking into account wetting periods can be calculated according to eq (19), where is the number of rainy days per year with precipitation exceeding 2.5 mm/d and 𝛿 is a calibrating parameter corresponding to the number of days during which concrete surface remains saturated after rain event. In sheltered condition, the number of rainy day is equal to zero (=0). Note also that the value is lower than 365.
Calibration of the model
Source and type of data
The dataset published by Vu [35] is used to calibrate the model. The inputs of the model cover the concrete mix design, the climatic data and the curing process. For the concrete mix-design the minimum information includes effective water content ( in [l/m3 of concrete]), the mass of clinker (: in [kg/m3 of concrete]) and the mass of supplementary cementitious materials ( in [kg/m3 of concrete] and where i covers limestone, slag, type V fly ash and pozzolan). The range of concrete compositions covered in [35] incudes binder content [220-400] [kg/m3], water to binder ratio [0.45-0.65] [g/g], air content [0.9-7] [vol%], and different maximum substitution level of Portland clinker by supplementary cementitious materials (limestone and pozzolan go up to 30 wt% whereas slag and fly ash go up to 50 [wt%]).
Concerning the climatic data, the minimum dataset required correspond to average values over available measured periods of the CO2 content ( in [%]), the temperature ( in [K]), the relative humidity ( in [%]), and number of rainy days over 2.5 mm per year (). The climatic data in 5 exposure locations (Lyon, Chennai, Austin, Fredericton and Changsha) were collected. T°, RH and precipitation were taken from [40] while the CO2 content was provided by partners if recorded on site. The value of these data is presented in the Table 3. It is noted that as the CO2 content was not available for Fredericton and Changsha, a value close to that in Austin was taken for Fredericton while a value close to that in Chennai was taken for Changsha.
Table 3.
Climatic input data used for 5 locations
| Lyon | Chennai | Austin | Fredericton | Changsha | |
| RH [%] | 68.9 | 70.9 | 66 | 73.2 | 73.4 |
| Tannual [C] | 13 | 28.7 | 20.2 | 6.4 | 18.1 |
| nCO2 [ppm] | 424 | 494 | 408 | 400 | 500 |
| 74 | 50 | 52 | 81 | 100 |
The conditions for accelerated carbonations are adapted from existing standard [1]. After an initial wet curing of 28 days, the 10×10×40 cm3 concrete samples are dried from all faces at 65% RH, 20°C for two weeks. The samples are then exposed to carbonation chamber with 1% CO2 and 65% RH. Carbonation depths are measured at 28, 56, 70 and 112 days.
Calibration strategy
From the mathematical point of view, the calibration strategy is a global sequential non iterative scheme. At each step of the sequence, a simple least square method, the well-known generalized reduced gradient non-linear algorithm, is used to minimize the sum of square of residuals and to find the accurate values of model parameters. The initial value of parameter are simply set to one for dimensionless parameter, or set to experimental value for parameter having a direct physical meaning. The three main steps of the sequence correspond to 1) accelerated carbonation data, 2) natural carbonation data for sheltered conditions 3) natural carbonation data for unsheltered conditions.
The parameters that are calculated at each of the three steps are given in Table 4. The initial and converged values for those parameters are given in Table 5 and are commented in the respective following sections 0, 0 and 0. At each step, every concrete composition is included in the minimization calculation. The residue is written according to eq (20), where is the experimental carbonation depth at time , the modeled carbonation depth, covers all experimental conditions and K is the carbonation rate in accelerated or natural conditions depending on the step of the sequence.
Table 4.
Conditions, concrete and parameters of interest at each step of the minimization sequence
| Step | Conditions | Concrete | parameters |
| 1 | Accelerated carbonation | All | , 𝛽, , , , |
| 2 | Natural carbonation, Sheltered | All | 𝜃, a, 𝜆 |
| 3 | Natural carbonation, Unsheltered | All | 𝛿 |
Calibration of the accelerated carbonation model
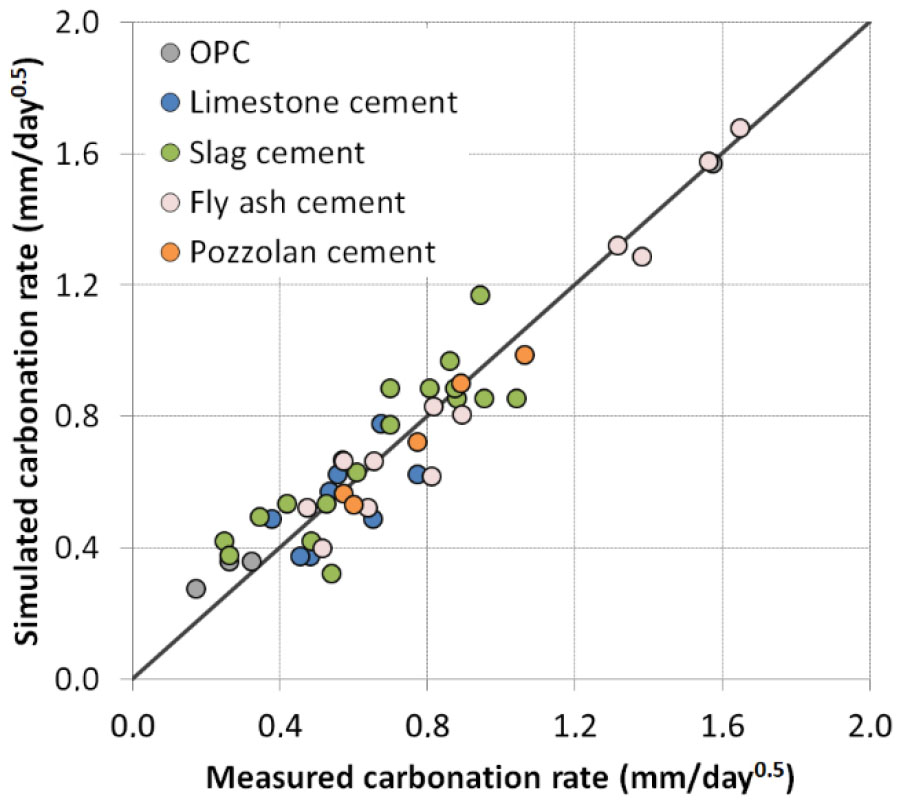
The value of different parameters calibrated using data on accelerated carbonation at 1% CO2 is given in the Table 5. It is shown in the Figure 4 that the model predicts well the accelerated carbonation rate for different types of cement. In the following, all the parameters calibrated for accelerated carbonation are kept constant while other parameters related to curing and exposure conditions need to be introduced and calibrated in order to link accelerated with natural carbonation.
Table 5.
Value of different parameters calibrated for each condition
Calibration of the model for sheltered condition
For sheltered condition protected from rain, 3 parameters of the proposed model need to be calibrated: correction factor 𝜃 for accelerated carbonation, parameter for relative humidity and curing factor 𝛾. Data from Vu et al. [35] were used for the calibration. In [35], 45 concretes using different supplementary cementing materials at varying substitution rate were exposed in 5 locations: Lyon (France), Austin (US), Chennai (India), Changsha (China) and Fredericton (Canada).
The calibrated values of 𝜃, and 𝜆 are also given in Table 5. It is to note that the value of 𝜃=1.6 is not far from the value of 𝜃=1.36 recommended in [3] while the value of =1 is comprised within the range proposed by different authors as mentioned in section 0.
In [35], curing of 1 and 28 days was considered for Lyon (France) while extended curing was considered for all the other locations. The carbonation depth was measured up to 5 years of exposure. The estimation of carbonation in sheltered condition was compared to experimental data and presented from Figure 5 to Figure 7.
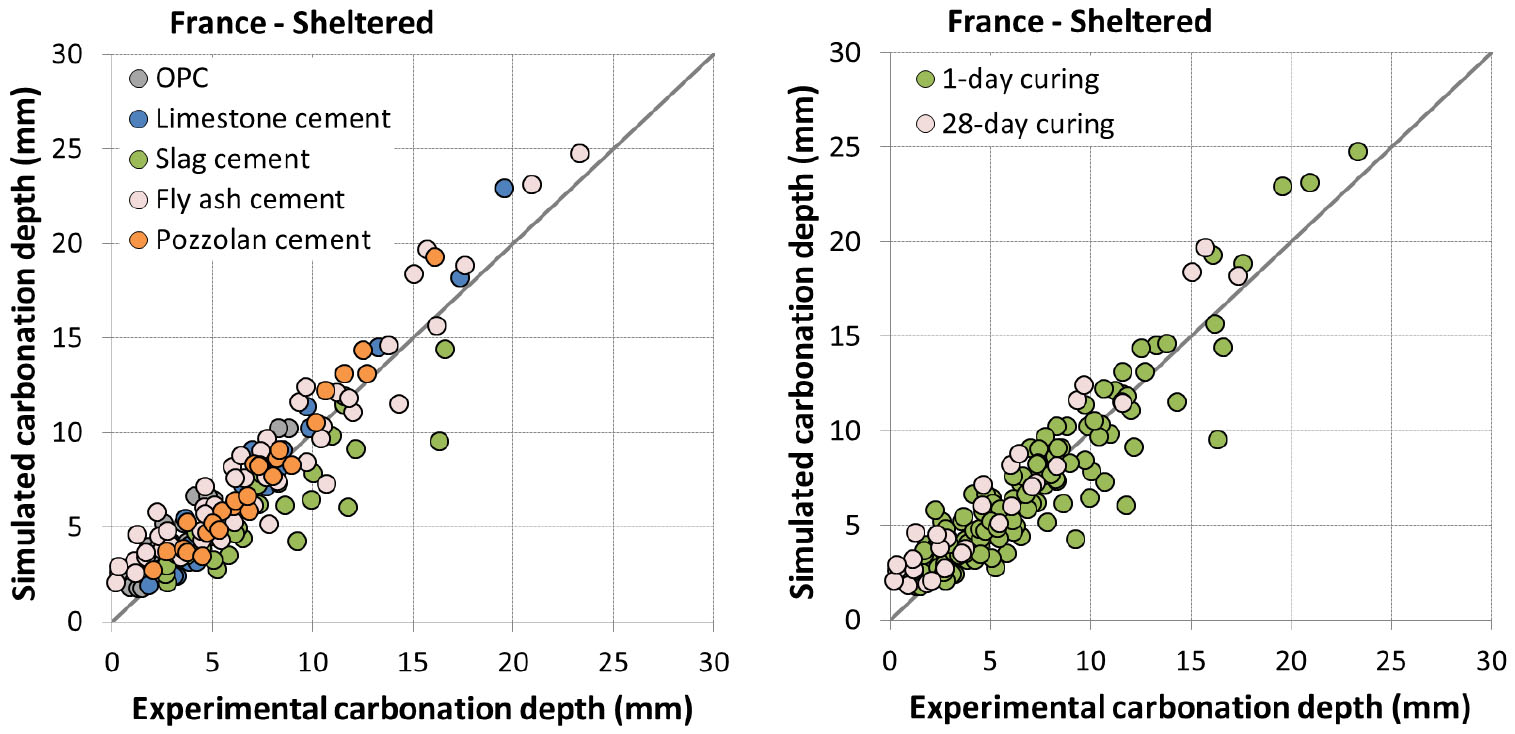
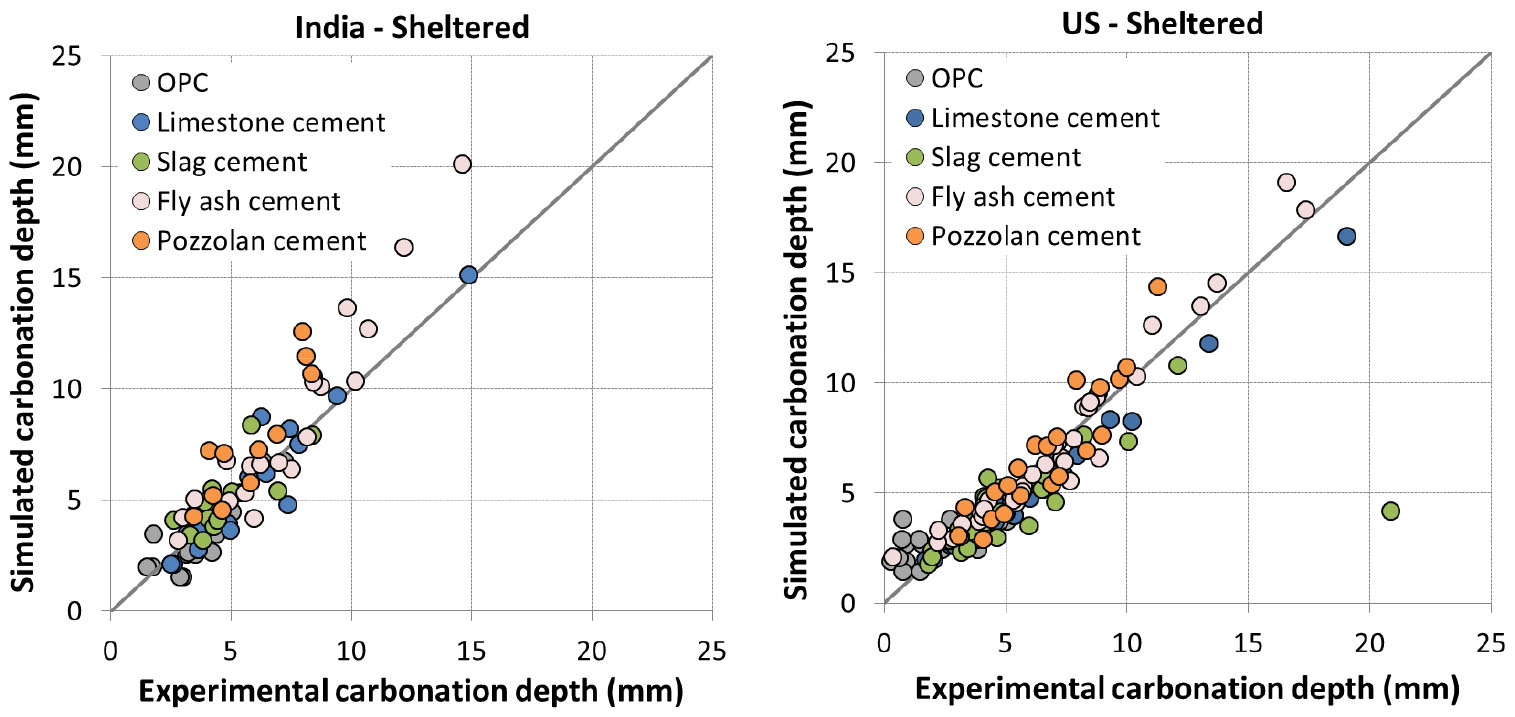
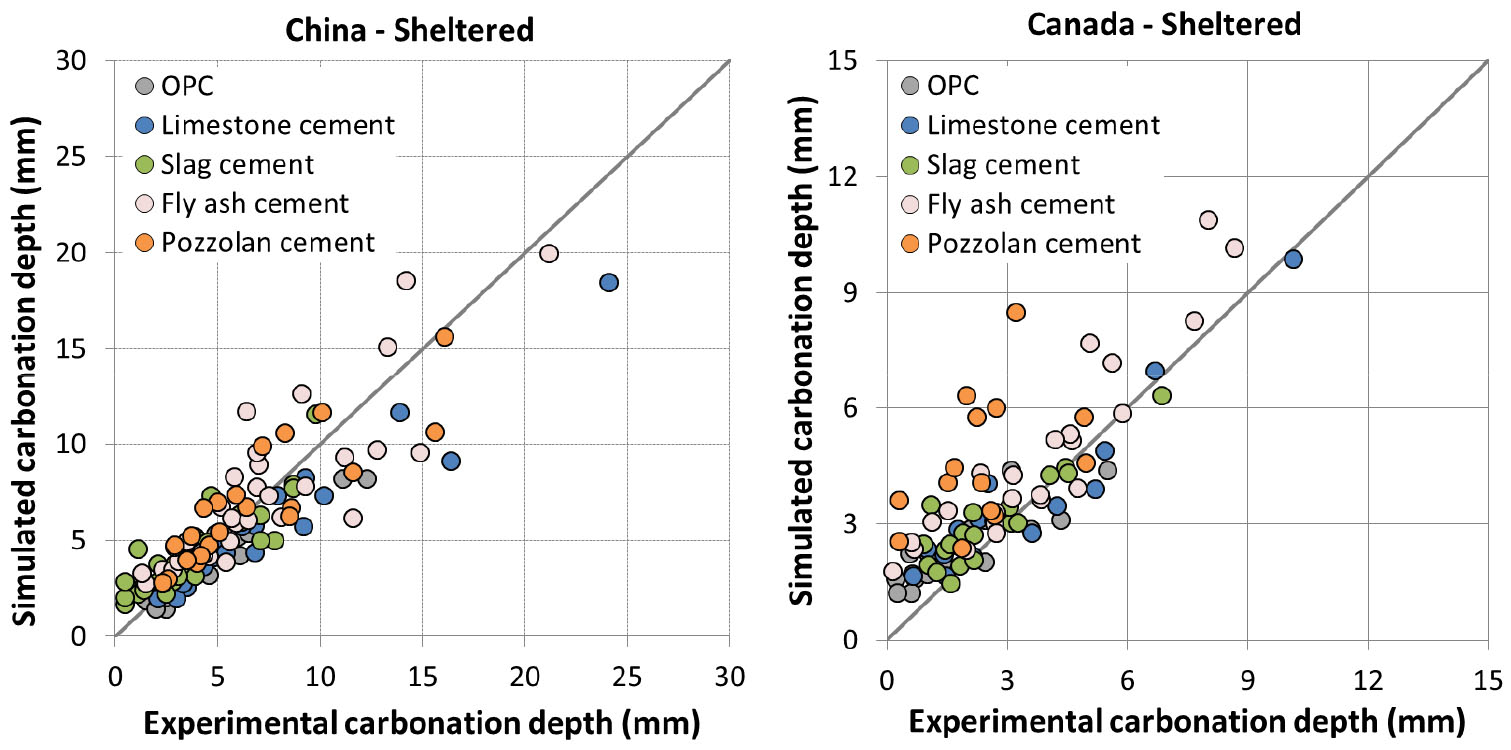
It is found that the model reproduces quite well the carbonation depth for Lyon, Chennai, Austin and Changsha. The accuracy of prediction appears comparable between different types of cement. The simulation is also good for both 1 and 28 day curing in Lyon. The comparison result is worse for Fredericton with some scattering. However, this is in agreement with Vu et al. [35] as experimental results for Fredericton were also scattered compared to those for other locations.
Calibration of the model for unsheltered condition
All the other parameters already calibrated for sheltered condition are kept constant to assess the effect of rainfall. The value of 𝛿 is the unique remaining parameter to assess the model for unsheltered condition (see section 0) and was also calibrated with data from [35].
Experiment was not realized in unsheltered condition for Canada. Concretes were exposed at 1 day curing for France while they were all exposed at advanced curing age for other locations. Simulation results are presented in Figure 8 and Figure 9.
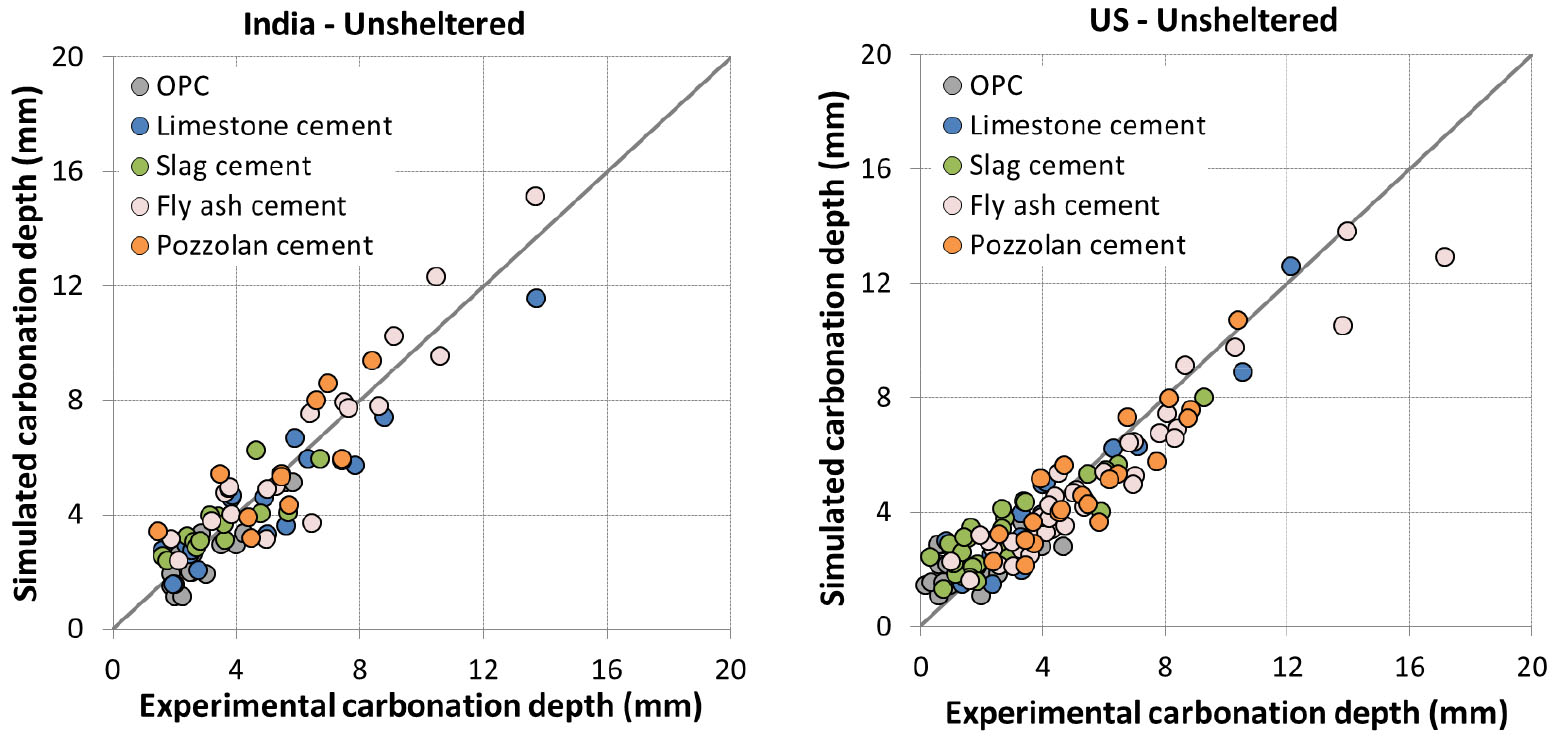
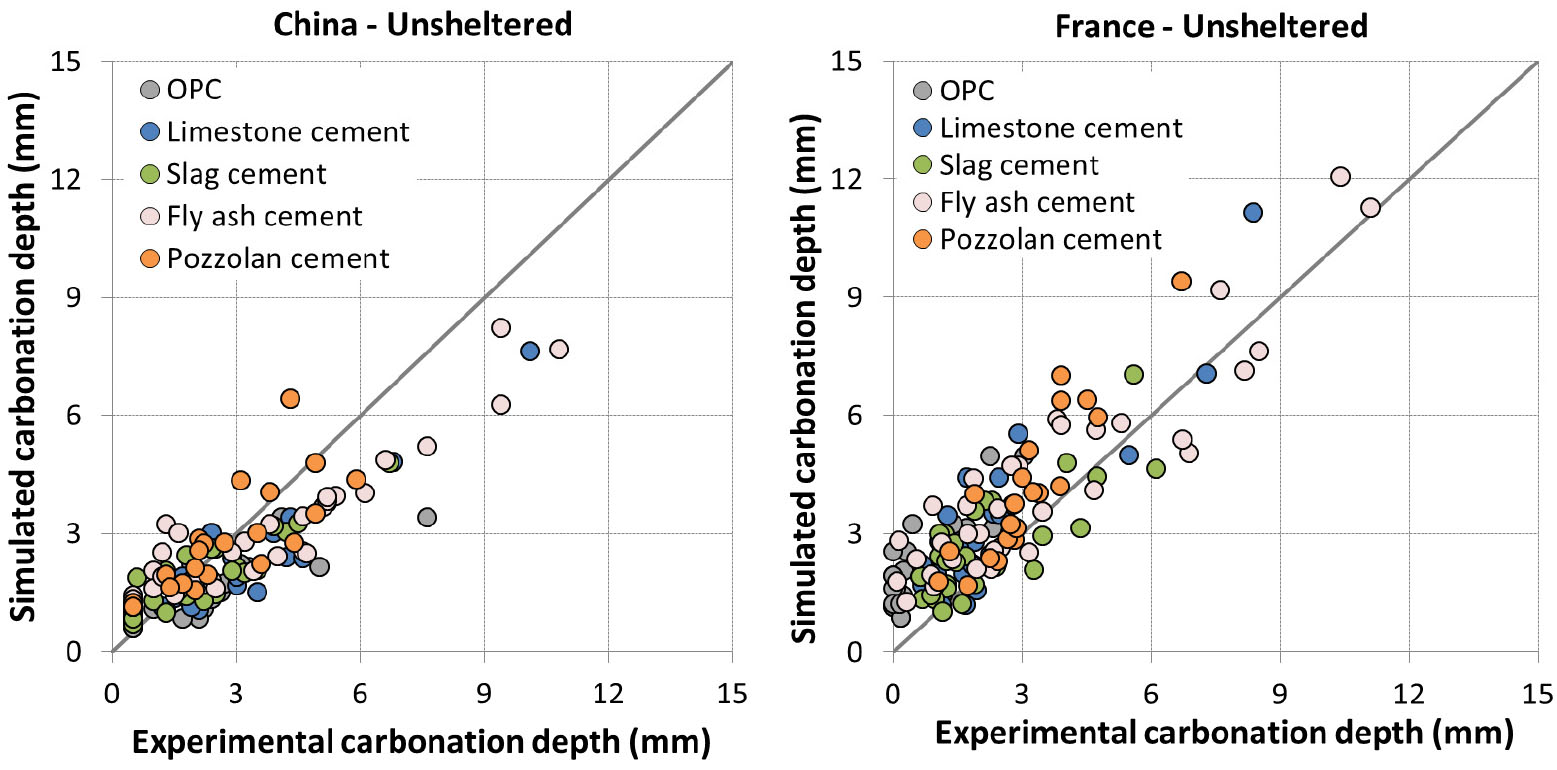
The prediction results are quite good for India and US (Figure 8). For China (Figure 9), the result is somewhat scattered which is however consistent with the comparison results of experimental data between China and other countries [35].
For France (Figure 9), the model tends to overestimate the carbonation. It is to note that for early curing ages, the impact of rain can be twofold: saturation of concrete surface and recovery of hydration. Since the prediction is good for 1 day curing in sheltered condition and for advanced curing ages in unsheltered condition, the large overestimation for 1 day curing in unsheltered condition may be related to the recovery of hydration which was not taken into account in the model.
Validation of the model prediction results
Source of data
The model with as-calibrated parameters was also validated against other data collected in the literature. These data cover a large range of climate type, concrete mix-design and test condition. In the regions considered, the annual temperature is ranged from 10°C to 27°C while the RH is ranged from 34% to 76%. The number of rainy days exceeding 2.5 mm in the year varies from 9 days to 90 days. In terms of concrete mix-design, both OPC and blended cements (with limestone, fly ash and slag) were considered with water to binder ratio (W/B) varying from 0.4 to 0.8. The replacement degree of addition reached a maximum of nearly 85%. More information about these data is given in Table 6.
Table 6.
Information about test conditions for different data collected in the literature
| Exposure condition | Type of cement | T° [source] | RH [source] | Rainy days ≥ 2.5 mm per year | CO2 content [source] | Exposure duration | |
| Balayssac [38] |
Lab controlled condition | Limestone cement | 20°C [38] | 60% [38] | 300 ppm [38] | 1.5 years | |
|
Younsi [41] (La Rochelle – France) | Indoor | OPC and fly ash cements | 19.4°C [41] | 50% [41] | 0 | 400 ppm [-] | 2 years |
| Al-Khayat [42] (Kuwait) | Unsheltered | OPC | 27°C [40] | 36% [40] | 9 days [40] | 375 ppm [43] | 8 years |
| Yunusa [34] (Johannesburg – South Africa) | Indoor |
OPC, type V fly ash and slag cements | 24°C [34] | 34% [34] | 0 | 308 ppm [34] | 2 years |
| Yunusa [34] (Johannesburg – South Africa) |
Outdoor sheltered |
OPC, type V fly ash and slag cements | 19.6°C [34] | 48.5% [34] | 0 | 292 ppm [34] | 2 years |
| Yunusa [34] (Johannesburg – South Africa) | Unsheltered |
OPC, type V fly ash and slag cements | 18.6°C [34] | 51% [34] | 42 days [40] | 270 ppm [34] | 2 years |
| Leemann [44] |
Lab controlled condition |
OPC, limestone, type V fly ash and slag cements | 20°C [44] | 57% [44] | 450 ppm [44] | 2 years | |
|
Leemann [44] (Zurich – Switzerland) | Sheltered |
OPC, limestone, type V fly ash and slag cements | 10°C [44] | 75.5% [44] | 0 | 400 ppm [-] | 2 years |
|
Leemann [44] (Zurich – Switzerland) | Unsheltered |
OPC, limestone, type V fly ash and slag cements | 10°C [44] | 75.5% [44] | 90 days [40] | 400 ppm [-] | 2 years |
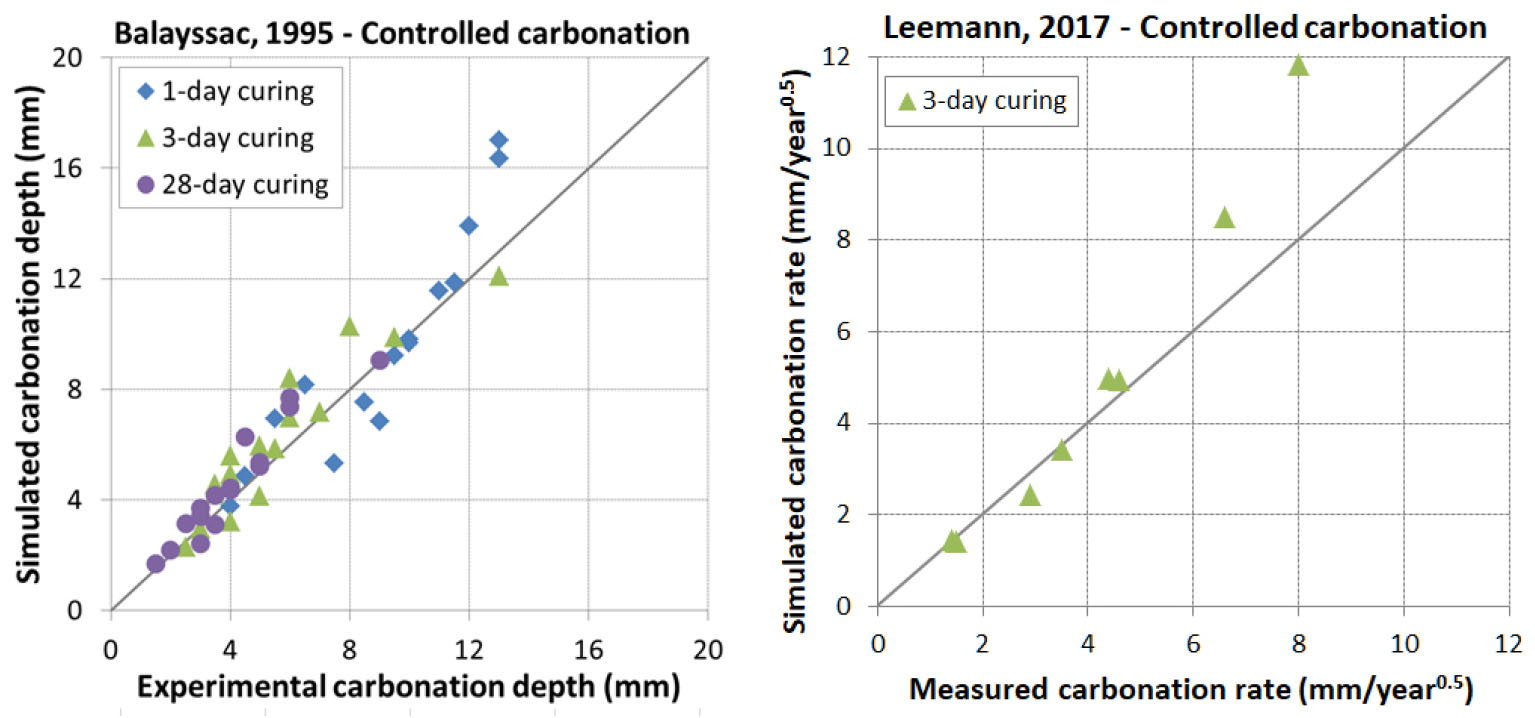
Controlled carbonation
In this condition, carbonation test is realized in laboratory where T° and RH are kept constant while the CO2 content is fixed at a value close to the atmospheric one. Two sources of data were collected, Balayssac [38] and Leemann [44]. In [38], limestone cement was used with a replacement degree of limestone fixed at 25% while the W/B ratio varied from 0.48 to 0.65. In [44], both OPC and blended cements (with limestone, type V fly ash and slag) were used with two W/B ratios of 0.4 and 0.65. The replacement degree of addition reached a maximum of nearly 70%. The comparison between experimental result and prediction with model is presented in Figure 10. It is found that the model reproduced very well the carbonation for both early age and mature curing. Some overestimation is however noticed for high values of carbonation.
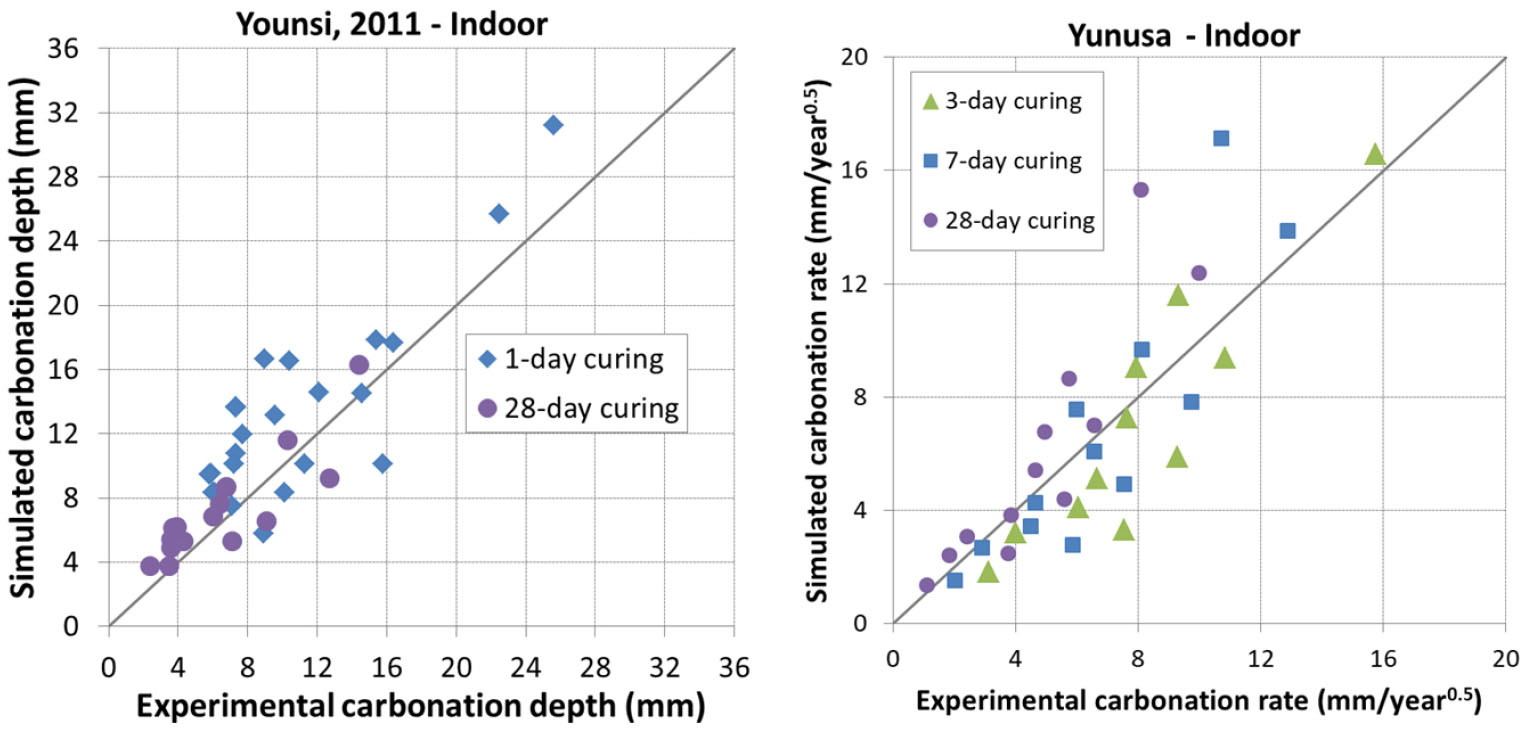
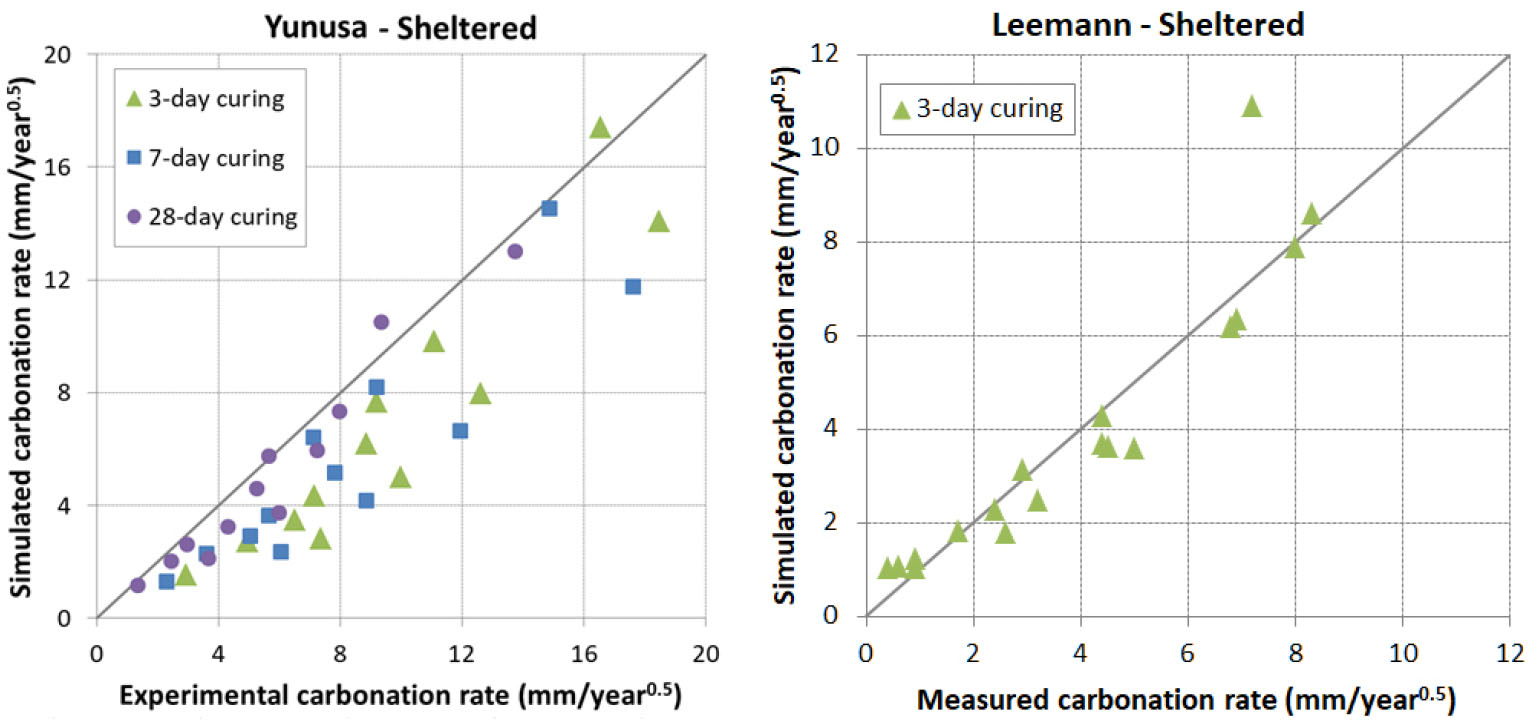
Indoor and sheltered carbonation
In this condition, samples are placed either in a room without any control of T°, RH and CO2 content or outdoor sheltered from rain fall. Three sources of data were considered, Yunusa [34], Younsi [41] and Leemann [44]. In [34], OPC, fly ash and slag cements were used with a W/B ratio varying from 0.4 to 0.75 and a maximum of replacement degree of addition reaching 50%. In [41], the same types of cement as in [34] were considered with a W/B ratio varying from 0.4 to 0.6 and a maximum of replacement degree of addition reaching nearly 85%. In [44], the same concretes as for controlled carbonation were used.
The prediction results are presented in Figure 11, Figure 12, Figure 13 and Figure 14. It is found that the prediction is acceptable in general. The model tends to underestimate the carbonation for early ages curing in sheltered condition for Yunusa’s data [34] while it predicts correctly for the other data.
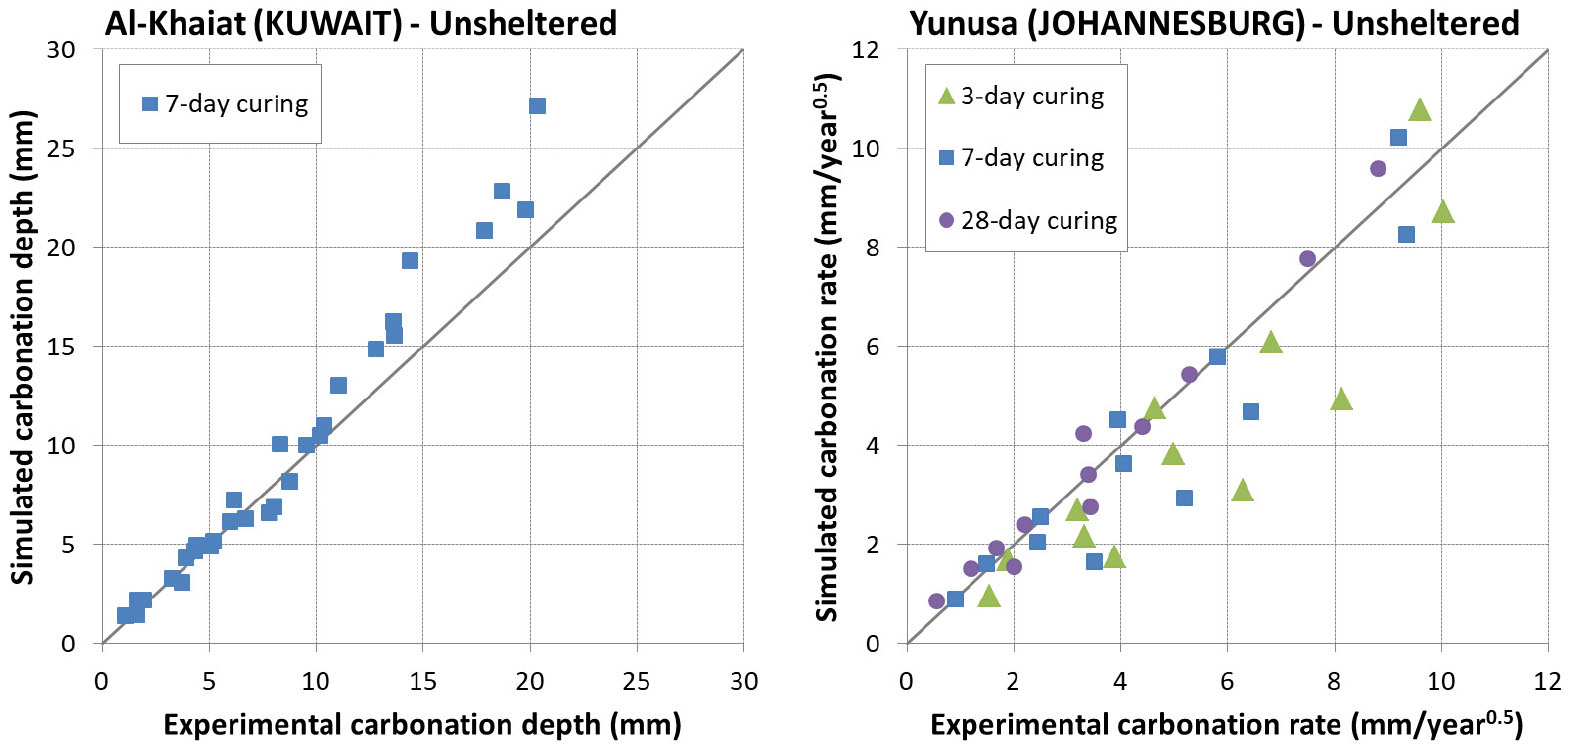
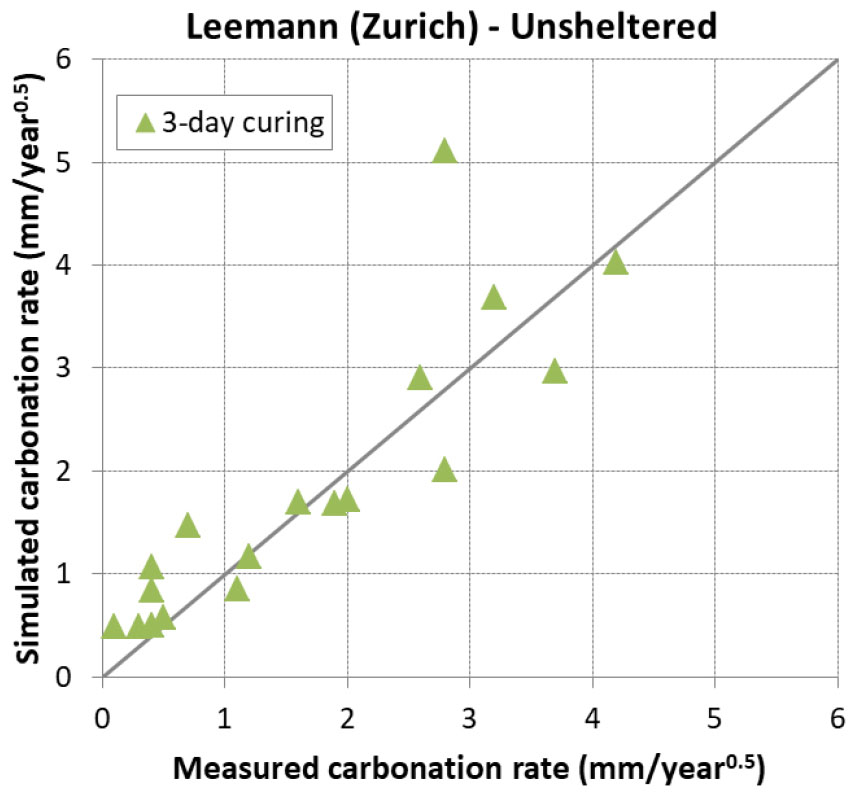
Unsheltered carbonation
In this condition, samples are placed outdoor unsheltered from rain fall. Besides data coming from Yunusa [34] and Leemann [44], another source of data coming from Al-Khayat [42] was considered. In [42], only OPC was used with a water to cement ratio varying from 0.45 to 0.8.
The prediction results are presented in Figure 15 and Figure 16. Again, it is found that the model reproduced very satisfactorily the carbonation for both early age and mature curing. This means also that the impact of rain was very well taken into account in the model.
Discussion
Model
The validation of the model on various data showed that the model can be adapted for a very large range of climatic condition as well as concrete mix-design and curing period. Although the model was initially calibrated on data that the annual RH ranged over 60%, it remains valid for very low values of RH approaching about 35%.
The model appears to be good for both carbonation depth and carbonation rate. It is however important to note a discrepancy between the carbonation rate in the model and that fitted from experimental measurement. In practice, the carbonation rate is customarily fitted from the measurement of carbonation depth as follows:
while A is set to 0 in the model. The fact that the model predicted well both carbonation depth and carbonation rate allows approving this choice.
The development of the model relied on two main steps: modeling of laboratory accelerated carbonation and passage from accelerated to natural carbonation. In each step, a limited number of calibrating parameters was required. For accelerated carbonation, except one supplementary parameter taking account the impact of each type of addition, only two parameters were used to characterize the carbonation rate. For passing from accelerated to natural carbonation, a correction factor taking into account the impact of curing and real climate conditions was applied. Three parameters were needed to build this correction factor.
The link between accelerated and natural carbonation assumed in the model was confirmed as the model reproduced very well the carbonation for both calibration steps mentioned above. This result is as interesting as it allows approving the use of accelerated carbonation as a durability indicator of concrete that is required in several standards. For each new type of cementitious additions, an extension of the database for various water content and addition substitution should be completed for a single curing condition (28 days water curing). In this work, model parameters needed to predict natural carbonation from accelerated carbonation are not specific to cement compositions based on the calibration current dataset [35] and validation dataset (see section 0).
Curing
The impact of curing on carbonation is huge at early ages as shown in Figure 2 and Figure 3. It is surprisingly noted that this impact is independent of the cement type (Figure 3). Vu et al. [35] explained that at very early ages, the size of pores within paste remains as large as capillary drying can occur, regardless of the cement type. Capillary drying is very fast and can reach significant depths very quickly. The hydration within this depth is then drastically slowed or stopped that facilitates the carbonation ingress.
The impact of early ages curing on carbonation is however dependent of the climatic condition (RH and T°) as assumed in the model. The fact that the model was satisfactorily validated on various data with very large range of climatic condition as well as concrete mix-design and curing period confirms the hypotheses made.
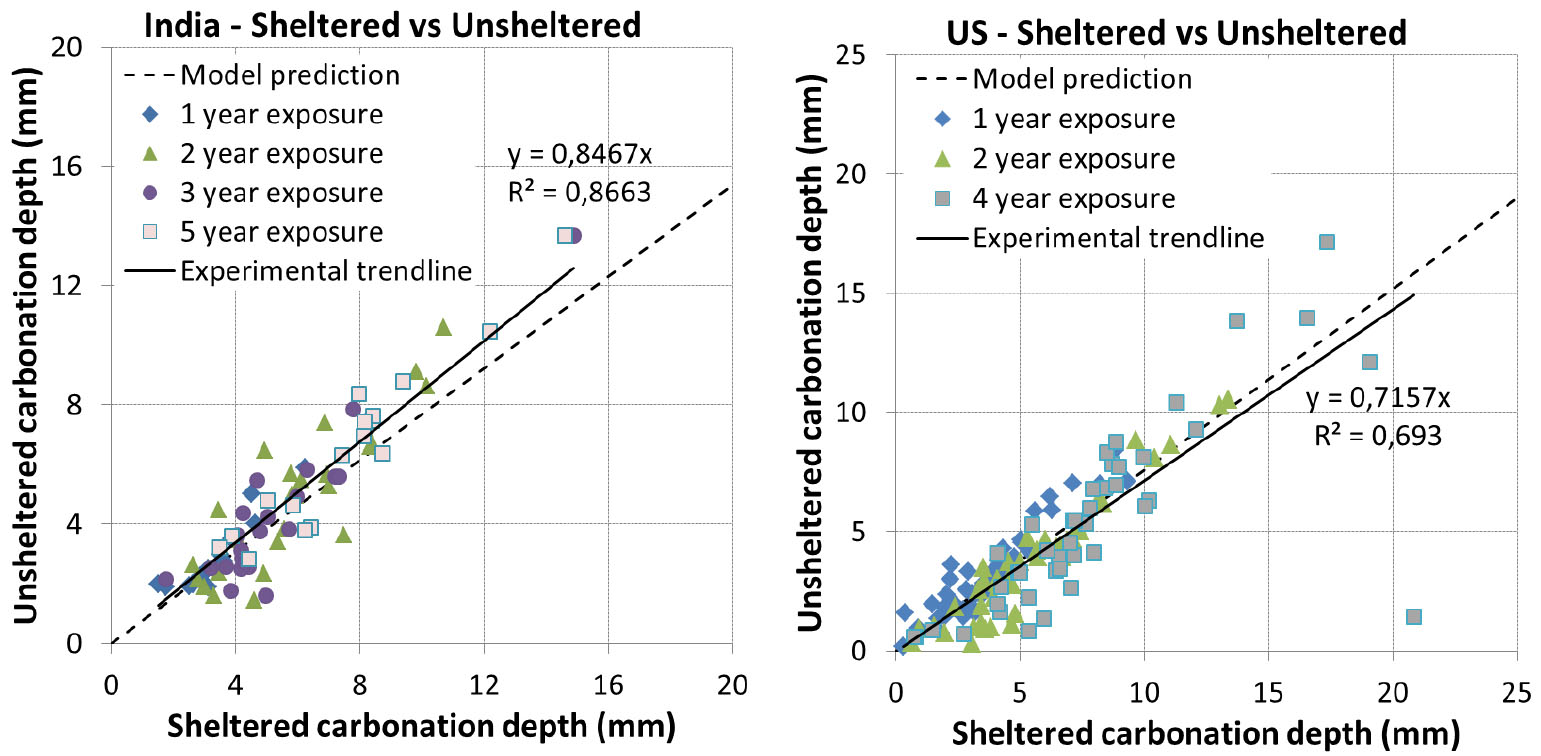
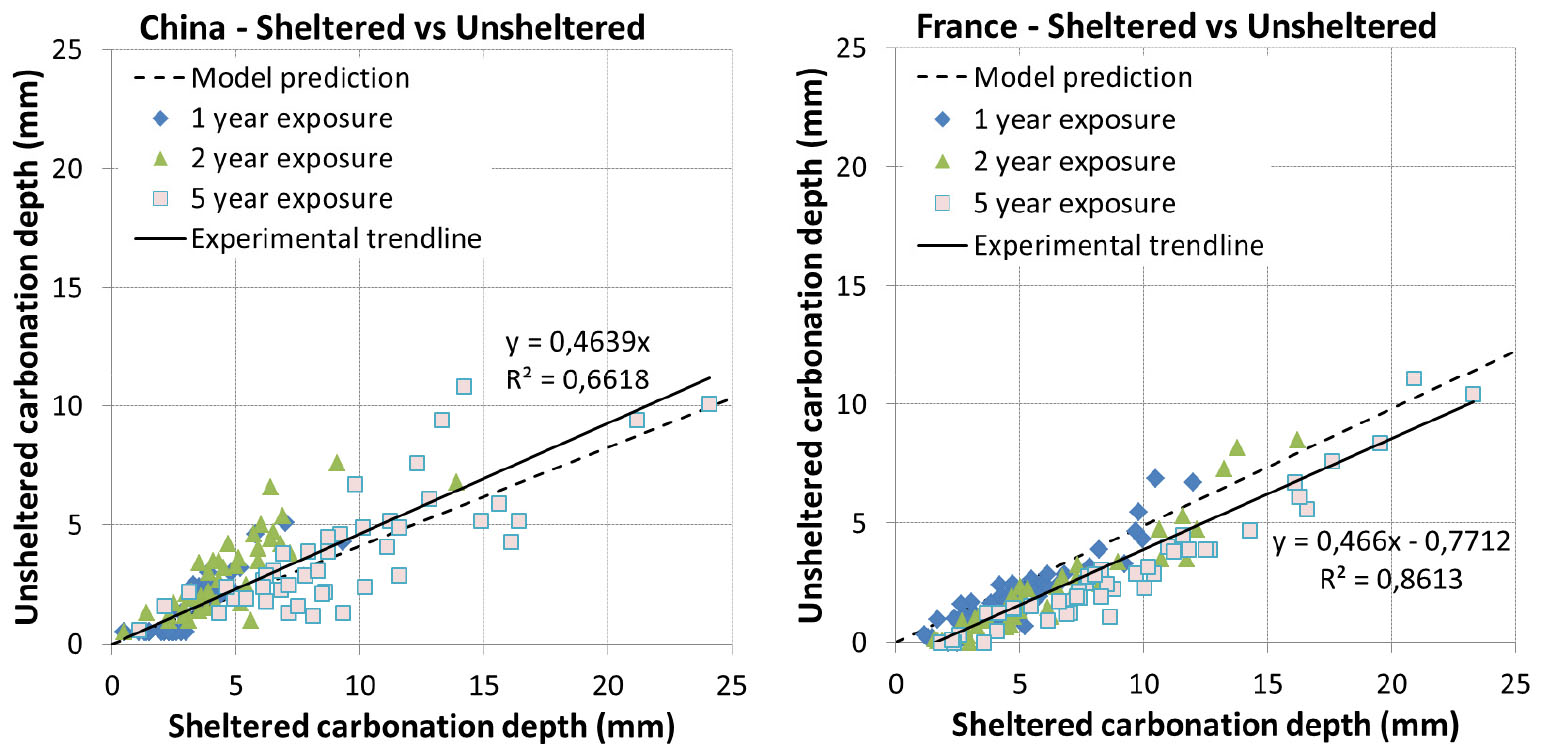
Effect of rain: sheltered vs unsheltered conditions
The comparison of carbonation between sheltered and unsheltered conditions is presented in Figure 15 and Figure 16 along with the model predictions. It is found that the predicted trend line is very close to the experimental one for India, US and China. Additionally, it is interesting to note that the experimental trend line passes by 0 for these 3 locations while this is not the case for France. There exists quite a shift between the predicted trend line and the experimental one for France, which may be related to a recovery of hydration of concretes exposed at 1 day curing as mentioned above.
Future development
The availability of data up to 5 years limits the range of carbonation depth data to 20 mm for most concrete and ~30 mm for the most reactive concrete. The depth over which hydration is influenced by early age drying is about the same order (1 to 5 cm) and increases with water to cement ratio [45, 46]. Therefore, in the future there would be a need to further expand not only the database but the model to extend its validity beyond the range of data for which it was calibrated (carbonation depth) by accounting for spatial (hydration gradient) and time dependency (wetting and drying cycles), yet keeping a front propagation model.
Form the mathematical point of view, the square root of time model (see eq (1) and (4)) is the solution of the governing equations for the front propagation eq (22). The latter equation is a linear ordinary differential equation, where is the maximum CO2 uptake, the CO2 effective diffusion coefficient, the CO2 concentration in the gas phase and the carbonation depth. As mentioned in [9], the square root of time solution is obtained assuming homogeneous material property and 1D Cartesian symmetry (carbonation front is a plane). Without going to full reactive transport model, which are very useful to decipher complex coupled mechanisms [23, 25], non-linear front propagation governing equation could be used to account for spatial or time distribution of material property. For example the binding capacity could be spatially dependent, , as a consequence of early age drying to reflect the hydration degree gradient or as a consequence of the skin effect. Also the diffusion coefficient could become time dependent as a function of water imbibition and drying cycles.
The predictions of the model focus on carbonation depth in 1D Cartesian geometry for applications in service life predictions. In the future, one could imagine calibrating also the model against additional experimental evidence, such as gas diffusivity bound CO2, or instantaneous rate of reaction to better account for the space and time dependency. Such a strategy would help in evaluating CO2 uptake by concrete both during the service life of structure and during the demolition stage but also calibrate some of the empirical constants of the model to physical properties.
The measurement of gas diffusivity of gas diffusivity has regain interest in recent years focusing on the method itself [47, 48], on the type of diffusing molecule [49, 50], on the role of carbonation [49, 51, 52], cracking [49] and water content [47, 49, 53, 54]. Those results highlighted the decrease of gas diffusivity with increasing water content by over two orders of magnitudes. The significant difference of carbonation rate in non-sheltered vs sheltered conditions, accounted for by the 𝛿 parameter (see section 0), could be related to hygroscopic properties but also CO2 diffusion in the carbonated zone.
Today, the model cannot predict the amount of bound CO2. However recent studies have analyzed the carbonation degree of cements within the carbonated zone of various cement based materials exposed to natural conditions [55, 56]. The bound CO2 content has been also analyzed on laboratory synthetic samples, both anhydrates and hydrates [57, 58], with two different methods: integration of instantaneous rate measurements [57] or direct measurement of cumulative rate with thermogravimetric analysis [58]. Therefore calibration of service life models on CO2 uptake seems realistic and their use could be extended to life cycle analysis LCA for a larger range of materials, climate and structure scenarios compared to the one proposed in existing European standards [59].
The linear carbonation front propagation with square root of time underpinning this model is valid for 1D Cartesian geometry, i.e. concrete walls. The application of this model to other geometries such as the one of recycled concrete aggregate would require deriving solutions of the carbonation front for a more representative geometry such as spheres. Indeed solutions of front propagation model for cylindrical or spherical geometry yield significant deviation of linear behavior with square root of time when front exceeds one third of the radius [60, 61].
One drawback of the model is inherently related to the available experimental data: only the cumulative rate of carbonation, i.e. the carbonation depth is measured at few points in time, typically at 0.5, 1, 1.5 and 2 years in the European carbonation standard [4] or even 5 years [35] and beyond [42, 62] for each set of experimental conditions. The measurement of instantaneous carbonation rates with non-destructive testing such as ultrasound [63] or CO2 depletion rate [57] at a much higher frequency for example within wetting and drying cycle would help growing tremendously the available dataset on concrete carbonation. With large dataset at hand one could then imagine using artificial intelligence to develop the next generation of concrete carbonation model [64].
This paper only reflects part of the service life modeling of a structure. Indeed, the proposed model is able to predict accurately the initiation period for concrete corrosion induced by carbonation in real climate and curing conditions. This allows a step further towards the estimation of the whole service life of structures. The other equally important part will be to correctly model the corrosion process and to integrate the effect of climate (rain, availability of oxygen, etc.) on the estimation of this propagation period in the calculation of the service life.
Conclusions
The main foundations of the models are:
⦁A simple relationship links natural carbonation in sheltered condition protected from rain to accelerated carbonation by considering the effect of exposure temperature and relative humidity, the impact of curing and a correction factor.
⦁The correction factor is introduced due to the fact that in accelerated conditions only the CO2 mass transfer is accelerated and not the water mass transfer, which leads to the accumulation of water at the carbonation front that lowers the global carbonation rate.
⦁The accelerated carbonation rate is estimated with the mix design (efficient water, mass of cement and supplementary cementitious materials) and 2+n fitting parameters (n: number of supplementary cementitious materials).
⦁The impact of temperature, relative humidity and curing (at a reference temperature and relative humidity) on natural carbonation rate are described using an Arrhenius, a power and an asymptotic function respectively.
⦁Moreover, the variation of temperature and relative humidity during the curing period strongly influences the carbonation. For relative humidity higher than the reference conditions (60%), the equivalent curing concept as proposed by Bazant is estimated with a temperature (Arrhenius equation) and relative humidity activation terms in order to consider the additional hydration.
⦁The annual average values over a long period of temperature and relative humidity are sufficient to quantify the impact of climatic conditions on carbonation rate. For unsheltered condition the impact of rain (i.e. wetting period) is accounted for by correcting the annual average RH.
The model is validated on various data collected in the literature for different exposure conditions and a vast range of climatic conditions.
⦁The model reproduces very well the carbonation for both early age and mature curing in controlled and sheltered carbonation conditions,
⦁For unsheltered carbonation the model reproduced very satisfactorily the carbonation for both early age and mature curing thanks to a sufficiently accurate modeling of the impact of rain.
⦁According to experimental data the impact of climates on the ratio of unsheltered to sheltered carbonation is not negligible; an average of three days of carbonation inhibition for each rainy day is valid for all concrete mix designs,
⦁The model highlights the link between natural and accelerated carbonation. This proves the relevance of using an accelerated test as a durability indicator as proposed in the standards.