

Introduction
Materials and Methods
Materials
Specimen preparation
Experimental methods
Microstructural characterization
Results and discussion
Fresh properties of OPC-NEPCMs concrete
Hardened properties of OPC-NEPCMs concrete
Heat of hydration of OPC-NEPCMs paste
Microstructural characterization of OPC-NEPCMs
Conclusion
Introduction
Recently, the application of phase change materials (PCMs) in the construction industry is getting huge attention in order to improve the thermal performance of concrete structures. There are a few studies that have been conducted with the use of PCMs of medium to high phase transition temperature which is effective in mitigating excessive temperature rises of an early-age mass concrete as well as reducing the thermal crack risk [1, 2]. Research on the use of PCMs as building materials, with various methods of incorporation, has found that the PCMs can store a significant amount of thermal energy within a building envelope with less structural mass compared to the sensible heat storage [3]. Besides, experimental and numerical evaluation of building thermal performance and effective thermal properties of concrete with PCMs have been reported in related studies [4].
While cement-based concrete containing PCMs having beneficial outcomes on the thermal properties of concrete, adverse consequences on mechanical properties have been reported in some studies. Meshgin and Xi have reported a 29% loss in compressive strength of concrete with the replacement of 20% PCMs with sand [5]. Only a few studies have focused on the reason behind these strengths reduction and the reported conclusions are different from each other. Dehdezi et al. have stated that the bursting phenomenon of the microencapsulated PCMs (MEPCMs) under loading state of the concrete was the underlying reason for the decrement in strength [6]. Yet the hydration effects of concrete with PCMs have not been considered. However, Hunger et al. [7] and Fernandes et al. [8] have identified that MEPCMs tend to damage during the mixing stage and leaked paraffin wax has interfered with the hydration products and cause the strength reduction. In general, incorporation of soft inclusion viz. micro or macroencapsulated PCMs inside the concrete matrix will decrease the mechanical properties of the composite [7, 8].
Based on the literature studies, the use of nanoencapsulated phase change materials (NEPCMs) are limited. The properties of the concrete involving NEPCMs as the concrete component are important as it may solve the above-mentioned problems. Thus, in this study, the NEPCMs are synthesized by using a simple sol-gel technique to examine the mechanical and microstructural properties of the concrete specimens incorporated with our own synthesized NEPCMs. Commercially available fatty acid i.e., dodecanoic acid has been chosen as the PCMs and has been encapsulated by silicon dioxide (SiO2). Then, the synthesized NEPCMs are added to the cement systems varied by a different percentage i.e., 0.5, 1.0, and 3.0%. The concrete specimens are cured inside a water tank and tested after 7, 14, and 28 days.
Materials and Methods
Materials
In this study, commercialized ordinary Portland cement (OPC) from Sungshin cement company, South Korea was used. The NEPCMs were synthesized by a simple sol-gel method by taking 50 g of core materials {Dodecanoic acid (C12H24O2)} and 10 ml of precursor material {tetraethyl orthosilicate (TEOS, C8H20O4Si)} for the formation of silicon dioxide (SiO2) shell. More detailed procedures of these encapsulation methods can be referred from our previously published articles [9, 10, 11]. The chemical composition of the OPC was analysed by an X-Ray fluorescence (XRF) spectrometer (ZSX PRIMUS IV, Rigaku, Tokyo, Japan) and the composition was depicted in Table 1. The low angle scattering technology was used to measure the particle size distribution (PSD) (Mastersizer 3000, Malvern Panalytical, United Kingdom) of OPC by using deionized water as the dispersant. Besides, the morphology of the OPC and NEPCMs were scrutinized by Scanning Electron Microscopy (SEM) (Hitachi S-4800, Tokyo, Japan) and Transmission electron microscopy (TEM) (JEOL, JEM 2010, Tokyo, Japan) was used for the NEPCMs. Differential scanning calorimeter (DSC) (TA Instrument, Discovery DSC, New Castle, United States of America) was operated to examine the thermal properties of the NEPCMs. All the PSD, SEM, and TEM analyses are presented in Figure 1. The thermal properties of the NEPCMs are tabulated in Table 2.
Table 1.
Chemical composition of OPC
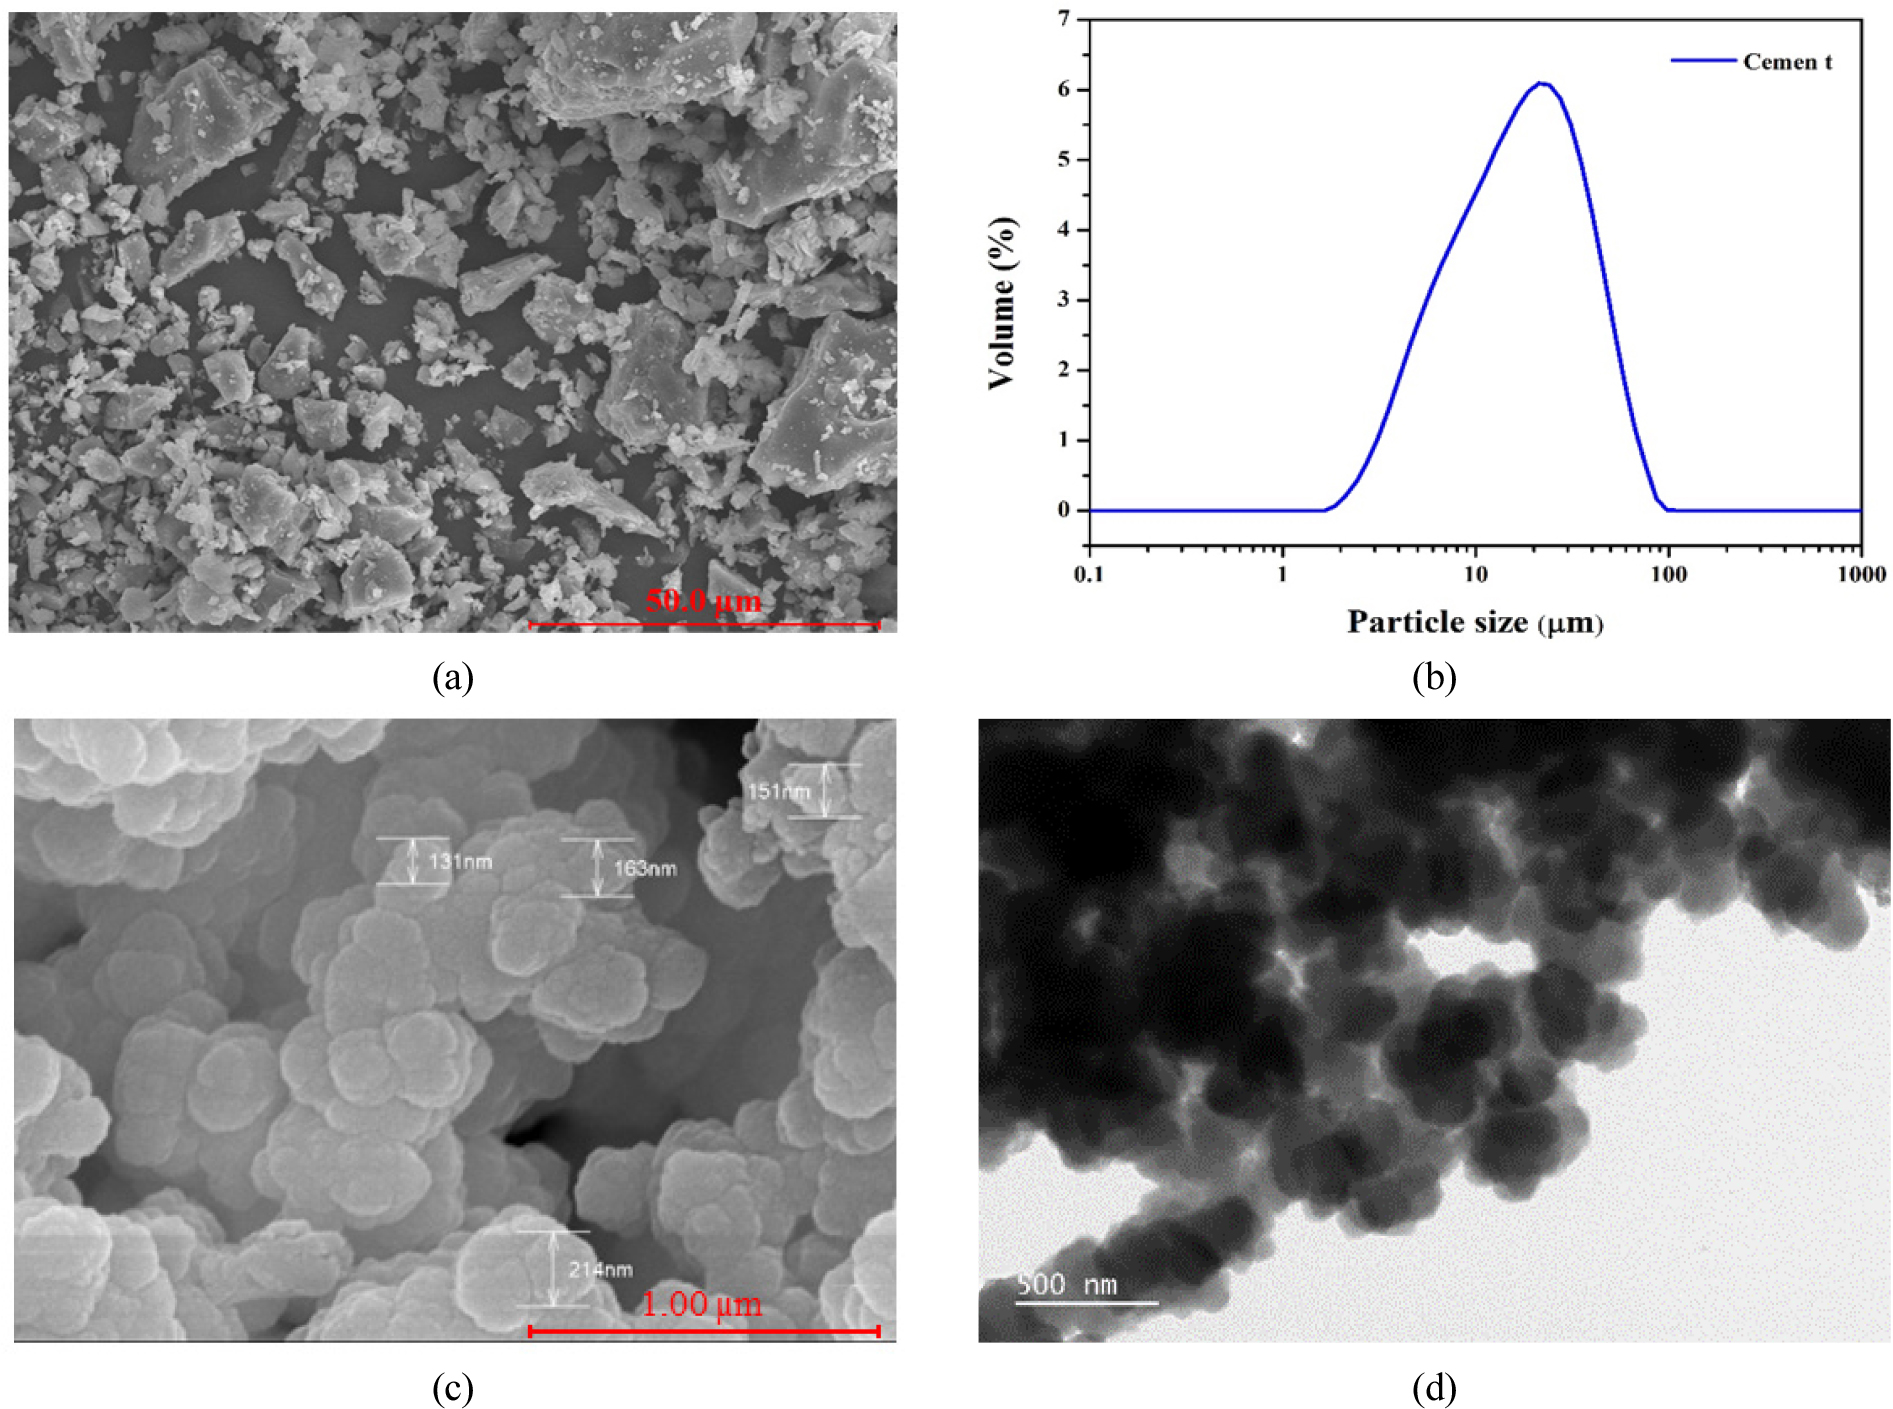
Table 2.
Thermal properties of the NEPCMs
| Sample ID | Melting | Solidifying | Encapsulation rate (%) | Encapsulation efficiency (%) | ||
| °C | J/g | °C | J/g | |||
| Dodecanoic acid | 44.46 | 166.8 | 38.49 | 159.6 | - | - |
| NEPCMs | 44.29 | 160.9 | 38.01 | 152.8 | 96.50 | 96.15 |
Specimen preparation
Table 3 shows the mix proportions [12] of the concrete specimens where three different amounts of NEPCMS (0.5, 1.0, and 3.0%) were selected and added into 100%OPC, and abbreviated as 0.5NEPCMs, 1.0NEPCMs, and 3.0NEPCMs, respectively. 100%OPC (100OPC) was chosen as the control sample. River sand and crushed gravel (20 mm nominal size) were used as the fine and coarse aggregates, respectively. Water-reducer type of superplasticizer was used to control the workability of the concrete. Water-to-binder (w/b) ratio of 0.5 was fixed throughout this study. All samples were undergone water curing for 7, 14, and 28 days prior to the test methods. For the microstructural analysis, the specimens in the form of paste were cast and ground for Fourier transform-infrared spectroscopy (FT-IR), x-ray diffraction (XRD), and field emission scanning electron microscopy (FESEM) analysis. The solvent exchange method [13] was used to stop the hydration process in accordance with the desired curing duration of 28 days.
Table 3.
Mix proportion of the OPC-NEPCMs concrete specimens
Experimental methods
Slump cone and apparent density test were conducted according to KS F 2402:2017 and KS F 2459:2017, respectively. The apparent density was calculated from Equation (1) as follows:
Where, Wois the specimen mass (g) and V is the volume of the specimen (m3). The compressive strength and tensile strength test were performed according to KS F 2459:2017 and KS F 2423:2016, respectively using a universal testing machine (DEC-30T, Dawha, South Korea) at a loading rate of 0.15 and 0.06 MPa/s, respectively. 100 × 200 mm cylindrical samples were cast and cured in water for 7, 14, and 28 days. Each specimen type was measured three times to obtain the average strength of both compressive and tensile results. Besides, water absorption test was performed according to KS F 2459:2017 after 28 days of curing duration. The absorption rate was calculated using Equation (2) as follows:
Where, Wois the mass of the specimen (g) after oven drying for 24 h at 105+5°C which ensure that all water has been evaporated. W1is the mass of the specimen (g) before the drying process. The heat release and cumulative heat of hydration of cement paste with NEPCMs were measured by an isothermal calorimeter (TAM-Air, TA Instruments, New Castle, DE, United States of America) for 120 hours at 30°C. An amount of 8 g of OPC was mixed with 4 ml of deionized water (100NEPCMs) whereas the addition of 0.04, 0.08, and 0.24 g of NEPCMs were added and abbreviated as 0.5NEPCMs, 1NEPCMs, and 3NEPCMs, respectively. The pastes were mixed by hand in glass ampoules (external mixing). Then, the ampoules were directly placed inside the isothermal calorimeter with standard sand (EN 196-1) as the reference material. The proportion of the paste has been presented in Table 4.
Table 4.
Mix proportion of paste sample
| Sample ID | Cement (g) | NEPCMs (g) | Water (ml) |
| 100OPC | 8 | - | 4 |
| 0.5NEPCMs | 0.04 | ||
| 1.0NEPCMs | 0.08 | ||
| 3.0NEPCMs | 0.24 |
Microstructural characterization
The XRD (D/MAX-2500, Rigaku, Japan) analysis of the pastes was performed at a scanning rate of 4°/min using Cu-Kα (λ = 1.541 Å) radiation with 25 kV and 100 mA operating conditions. The chemical composition of the hydrated phases was studied by FTIR (Perkin Elmer UATR Two, United States of America) analysis from 500 to 4000 cm-1 wavenumbers. The morphology of the paste samples was investigated by FESEM (Hitachi S-4800, Tokyo, Japan) analysis.
Results and discussion
Fresh properties of OPC-NEPCMs concrete
In this study, a slump of 180 mm is maintained for all types of samples. As shown in Table 3, the amount of superplasticizer is increased as the amount of NEPCMs increases. From our observation during the casting time, the addition of NEPCMs causes absorbing of water which further reduces the workability of the concrete. Thus, the amount of the superplasticizer is increased by 0.04, 0.20, and 0.50% with the addition of 0.5, 1.0, and 3.0% of NEPCMs in order to fulfil the requirements of a good workability of concrete [14].
Hardened properties of OPC-NEPCMs concrete
Figure 2 shows the compressive and tensile strength results of OPC-NEPCMs concretes associated with the density values. As the amount of the NEPCMs is increased, both the compressive and tensile strength are decreased along with the decrement in density values. According to Figure 2(a), with the addition of 0.5% NEPCMs, the compressive strength and density are reduced by 7.9 and 2.0%, respectively, compared to 100OPC samples. Once the amount of NEPCMs is increased to 1.0% and 3.0%, the compressive strengths are prominently reduced by 45 and 79%, with 5.02 and 17.94% density reduction, respectively. The trend of the compressive strength results (Figure 2(a)) is almost similar to the tensile strength results (Figure 2(b)). With the addition of 0.5% NEPCMs, the tensile strength is decreased by 15.6%, with the reduction in density by almost 2.0%. Hussain et al. investigated the uses of nanoencapsulated N-octadecane with polymethyl methacrylate PCMs, where the compressive strength is decreased by 11, 19, 32, and 50% with the addition of 0.5, 1.0, 1.5, and 10% PCMs, respectively [15]. Due to the soft mechanical strength and rigidity of the encapsulated PCMs, they might be easily broken under compressive force causing the reduction in strength [7, 16]. All of these strength reduction is corroborated with the previous study which mostly focused on the implementation of micro-sized PCMs [4, 5, 7]. However, with the addition of 0.5% NEPCMs, the compressive strength reduction is only 7.9%, which is considered low compared to other previously published data.
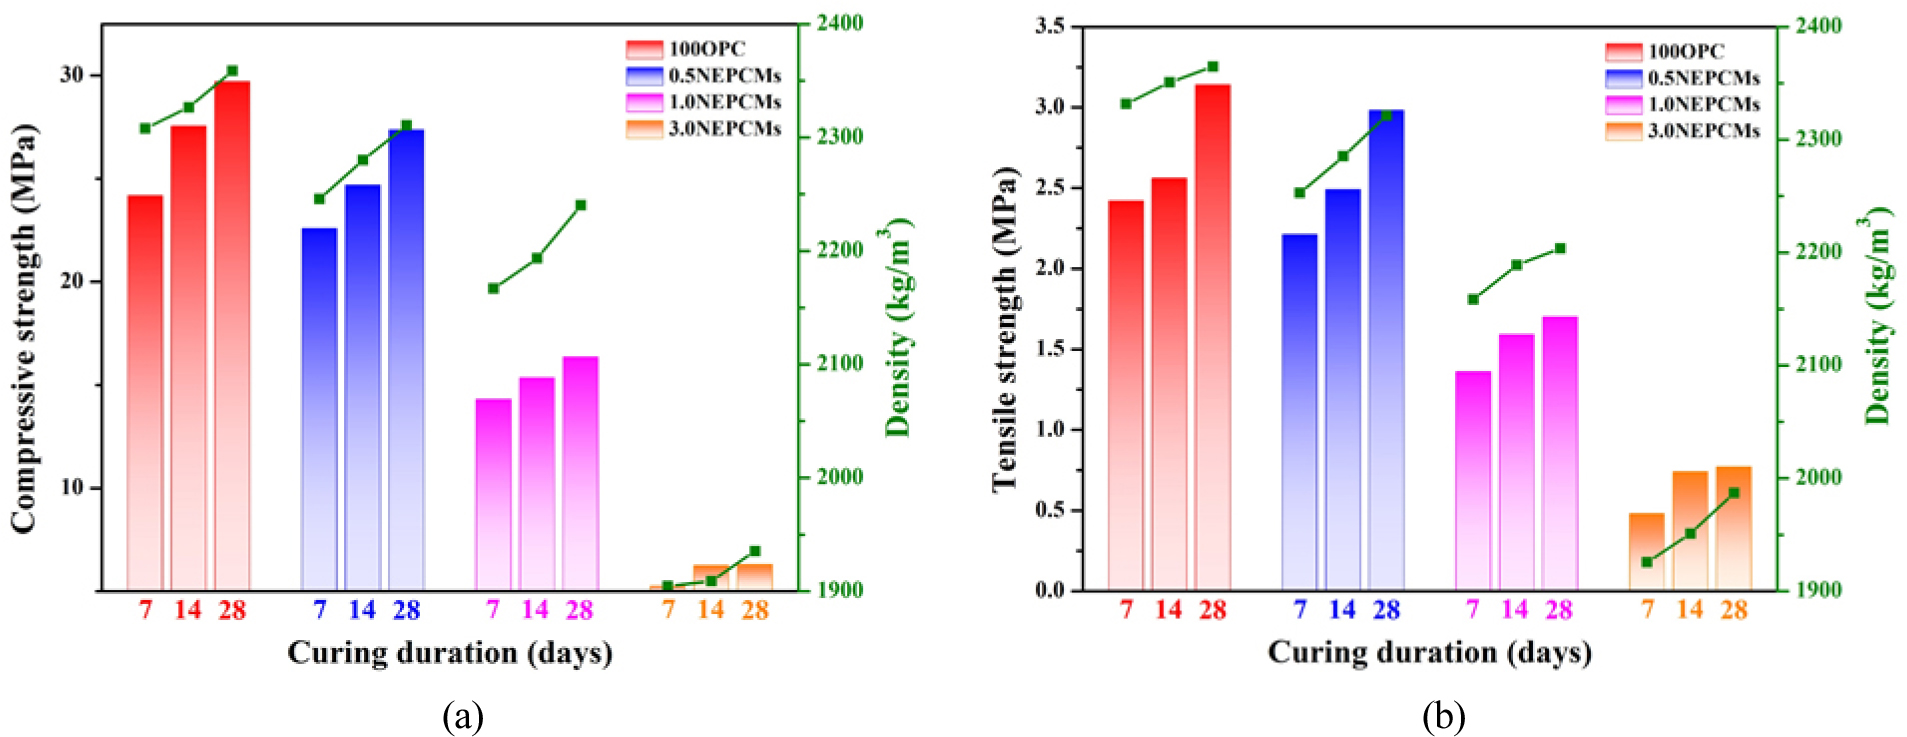
Apart from that, the water absorption properties of the OPC-NEPCMs concrete is studied and presented in Table 5. It shows that the rate of the absorption of 100OPC, 0.5NEPCMs, 1.0NEPCMs, and 3.0NEPCs are found to be 2.89, 2.91, 3.04, and 4.46%, respectively. A higher absorption rate might be attributed to the increase in porosity of the OPC-NEPCMs concrete owing to the amount of NEPCMs used. According to the previous study, the addition of PCMs capsule have increased the porosity of the cement mortar which contributes to the degradation of the mechanical characteristics [17]. Thus, the findings of the strength reduction and increased in porosity are verified to each other and this result is consistent with other microencapsulated PCMs-concrete studies [7, 16, 17].
Table 5.
Absorption test of OPC-NEPCMs concrete
| Sample ID | Absorption rate (%) |
| 100OPC | 2.89 |
| 0.5NEPCMs | 2.91 |
| 1.0NEPCMs | 3.04 |
| 3.0NEPCMs | 4.46 |
Heat of hydration of OPC-NEPCMs paste
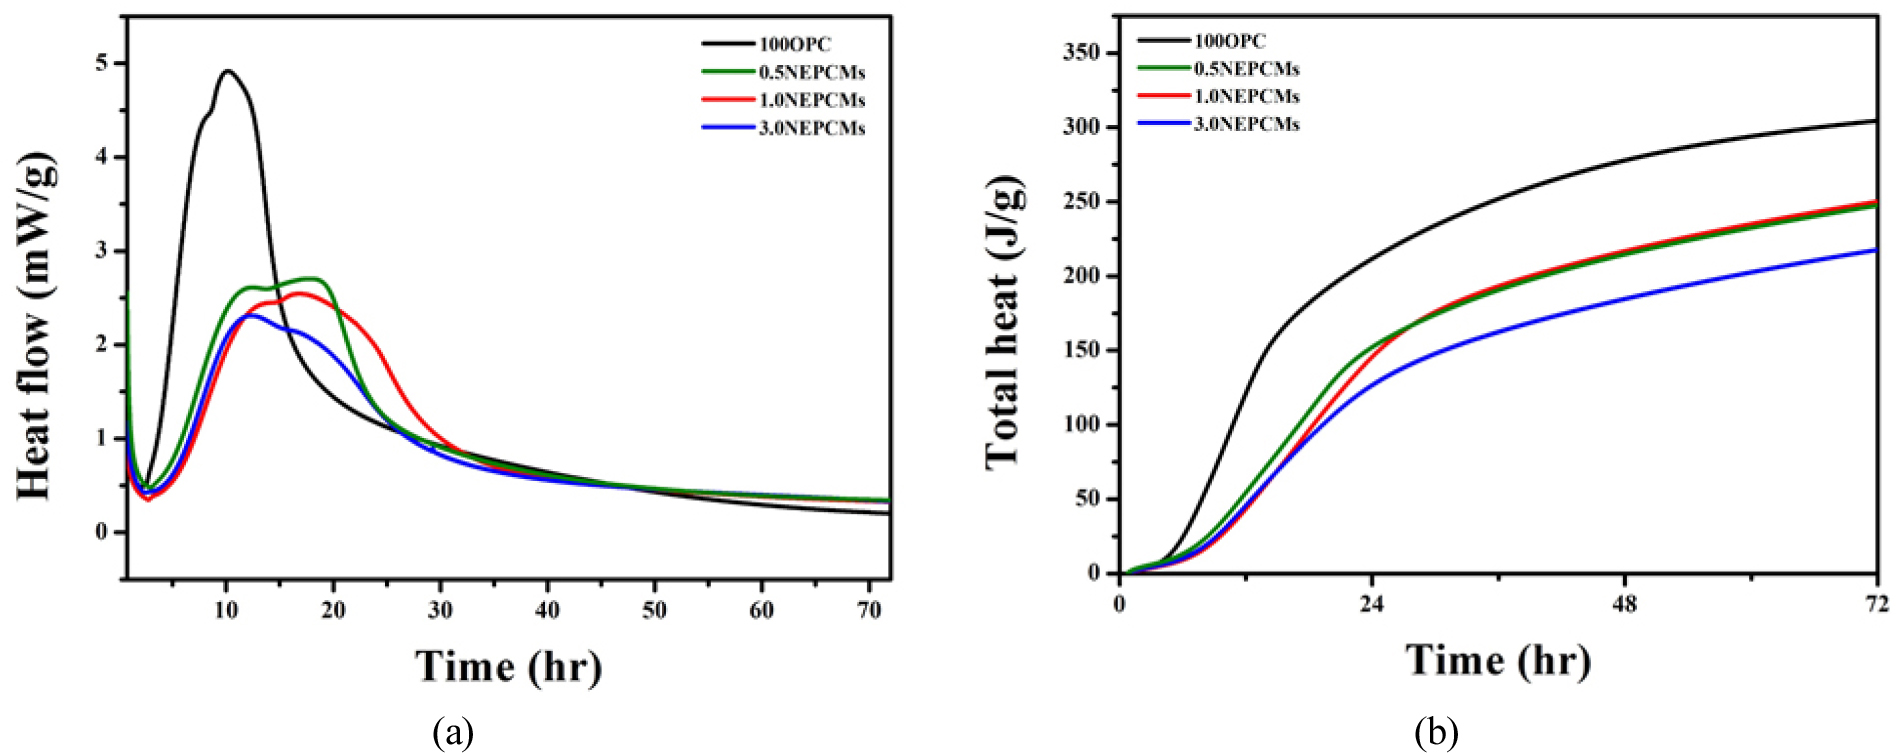
The rate of heat evolution and total heat production up to 72 h are shown in Figure 3. The maximum rate of heat evolution of 100OPC is identified after 10 h, and the maximum rate of 0.5NEPCMs, 1.0NEPCMs, and 3.0NEPCMs are recognized after 18.0, 16.8, and 12.3 h, respectively. Besides, the total heat production of 100OPC, 0.5NEPCMs, 1.0NEPCMs, and 3.0NEPCMs are found to be 307.3, 252.3, 254.7, and 222.2 J/g, respectively. The peak owing to the ettringite formation is found at time<10 h, while the maximum peak of the heat evolution is attributed to the hydration of tricalcium silicate (C3S) and dicalcium silicate (C2S) [18]. With the addition of only 3% NEPCMs, the maximum rate of heat is reduced by 45% with a total heat reduction of 55 J/g. 3.0NEPCMs exhibits strong heat retardation and the thermogram is different from the 100OPC curve. It shows that with the addition of a small amount of NEPCMs, the hydration heat produced could be absorbed by the PCMs which will give benefits especially in solving the mass concrete problems due to the heat of hydration [1, 19].
Microstructural characterization of OPC-NEPCMs
Figure 4 shows the XRD analysis of 100OPC, 0.5NEPCMs, 1.0NEPCMs, and 3.0NEPCMs samples after 7, 14, and 28 days curing durations. It is clearly depicted that all types of samples exhibit the same formation of hydrated products of calcium silicate hydrate (C-S-H), calcium hydroxide (CH), calcite, and ettringite which confirms that there is no new peak formation with the addition of NEPCMs into the concrete mixture. For the 100OPC sample, the formation of hydrated products is more compared to other samples i.e., 0.5NEPCMs, 1.0NEPCMs, and 3.0NEPCMs samples. Meanwhile, with the addition of 0.5% NEPCMs, the formation of the hydrated products is higher compared to 1.0NEPCMs and 3.0NEPCMs samples. Once the amount of the NEPCMs is increasing to 3%, the hydration reaction is hindered and resulted in a very weak peak of the hydrated products, which has caused a very low compressive and tensile strength (Figure 2).
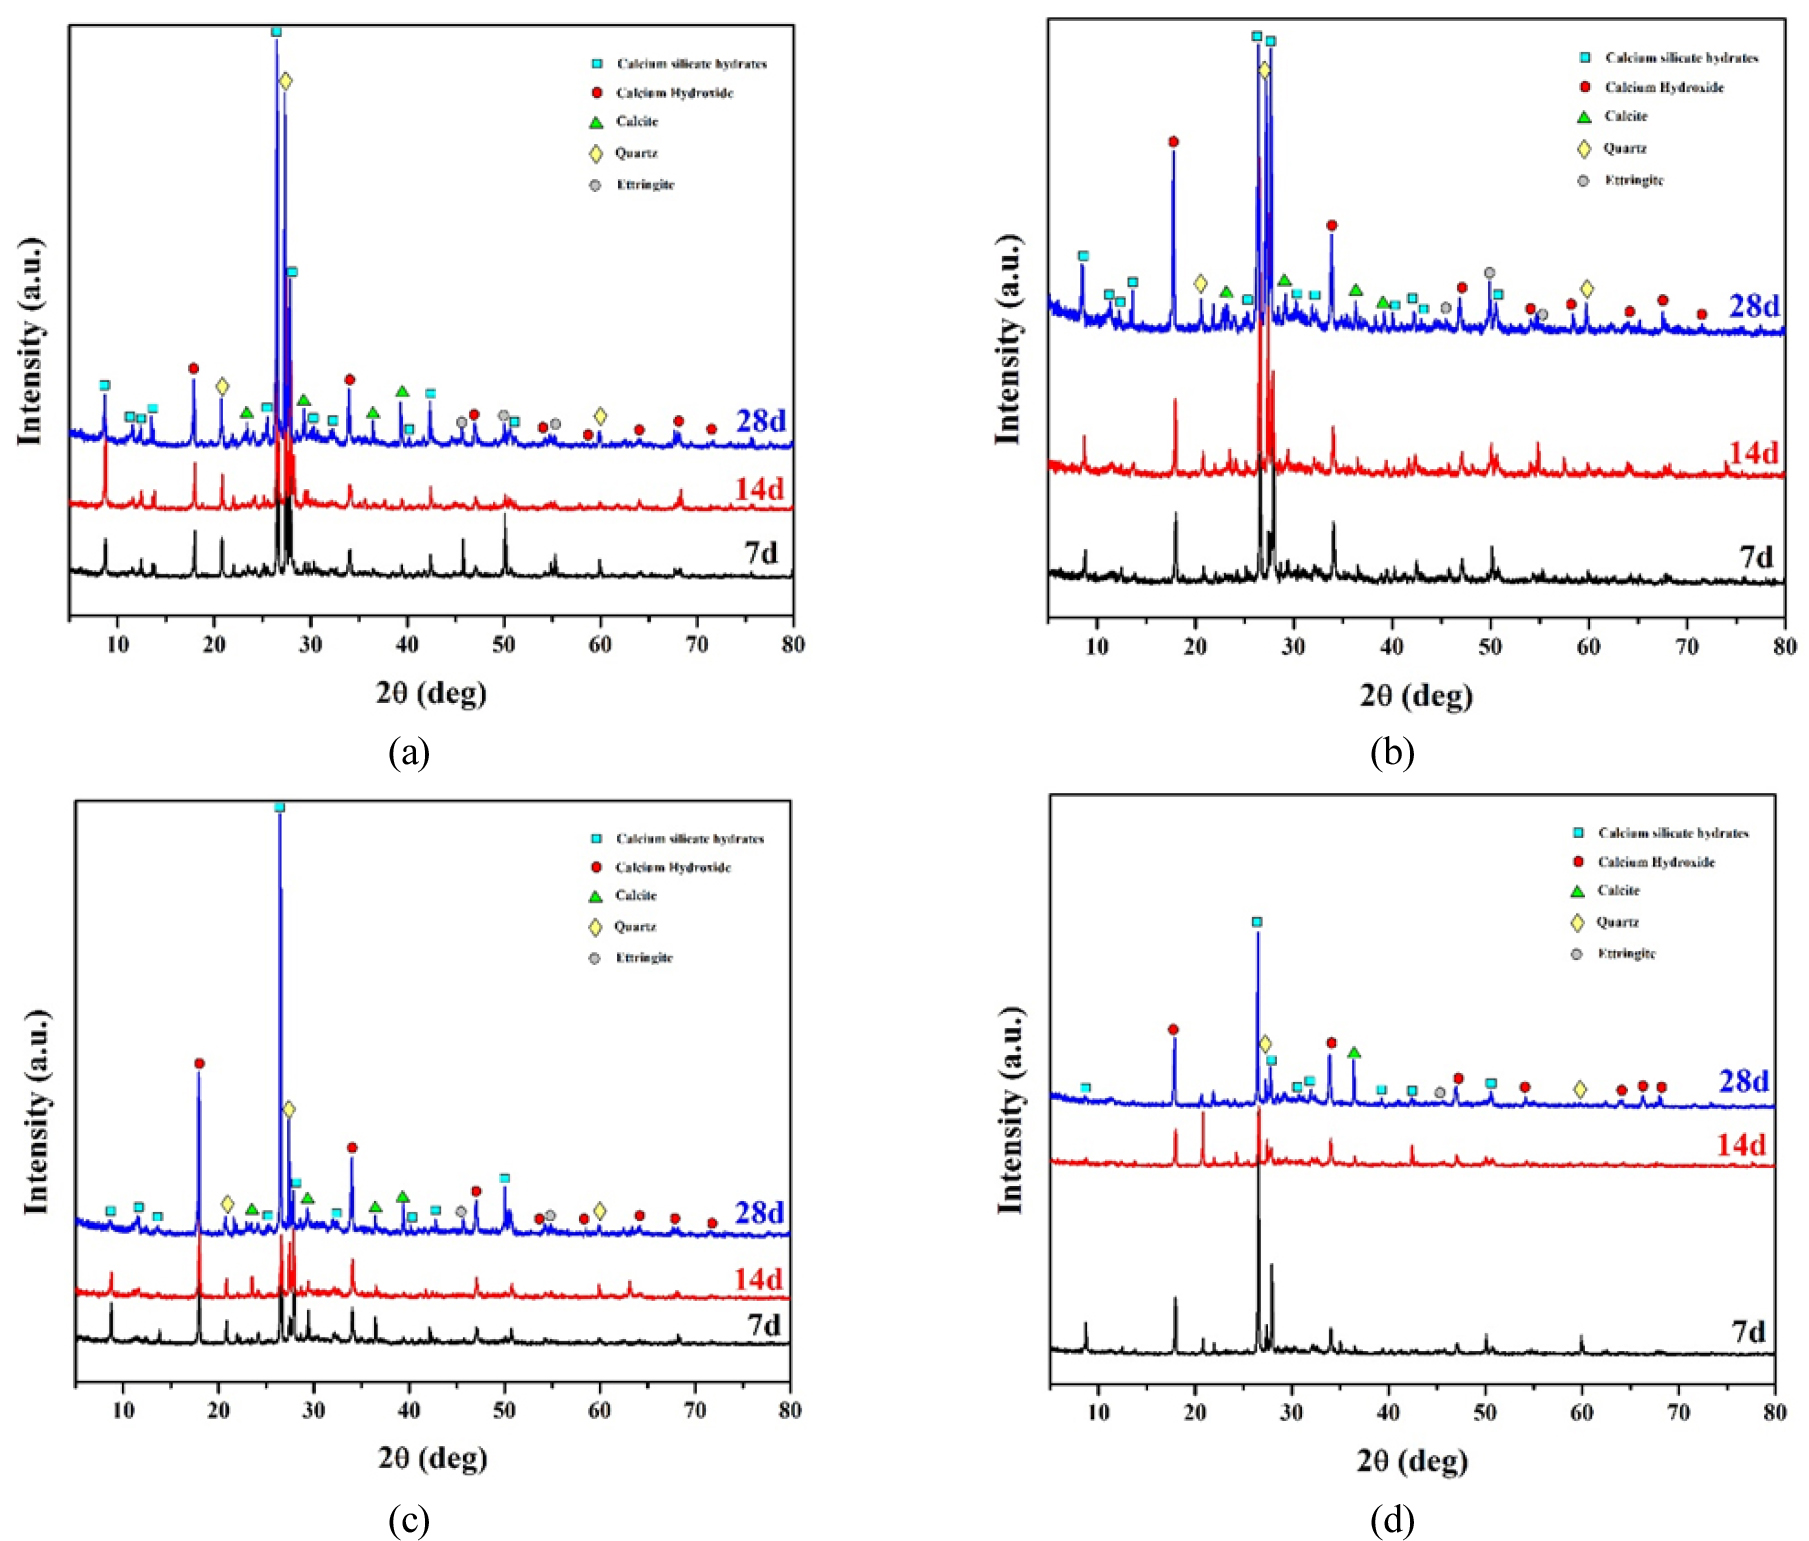
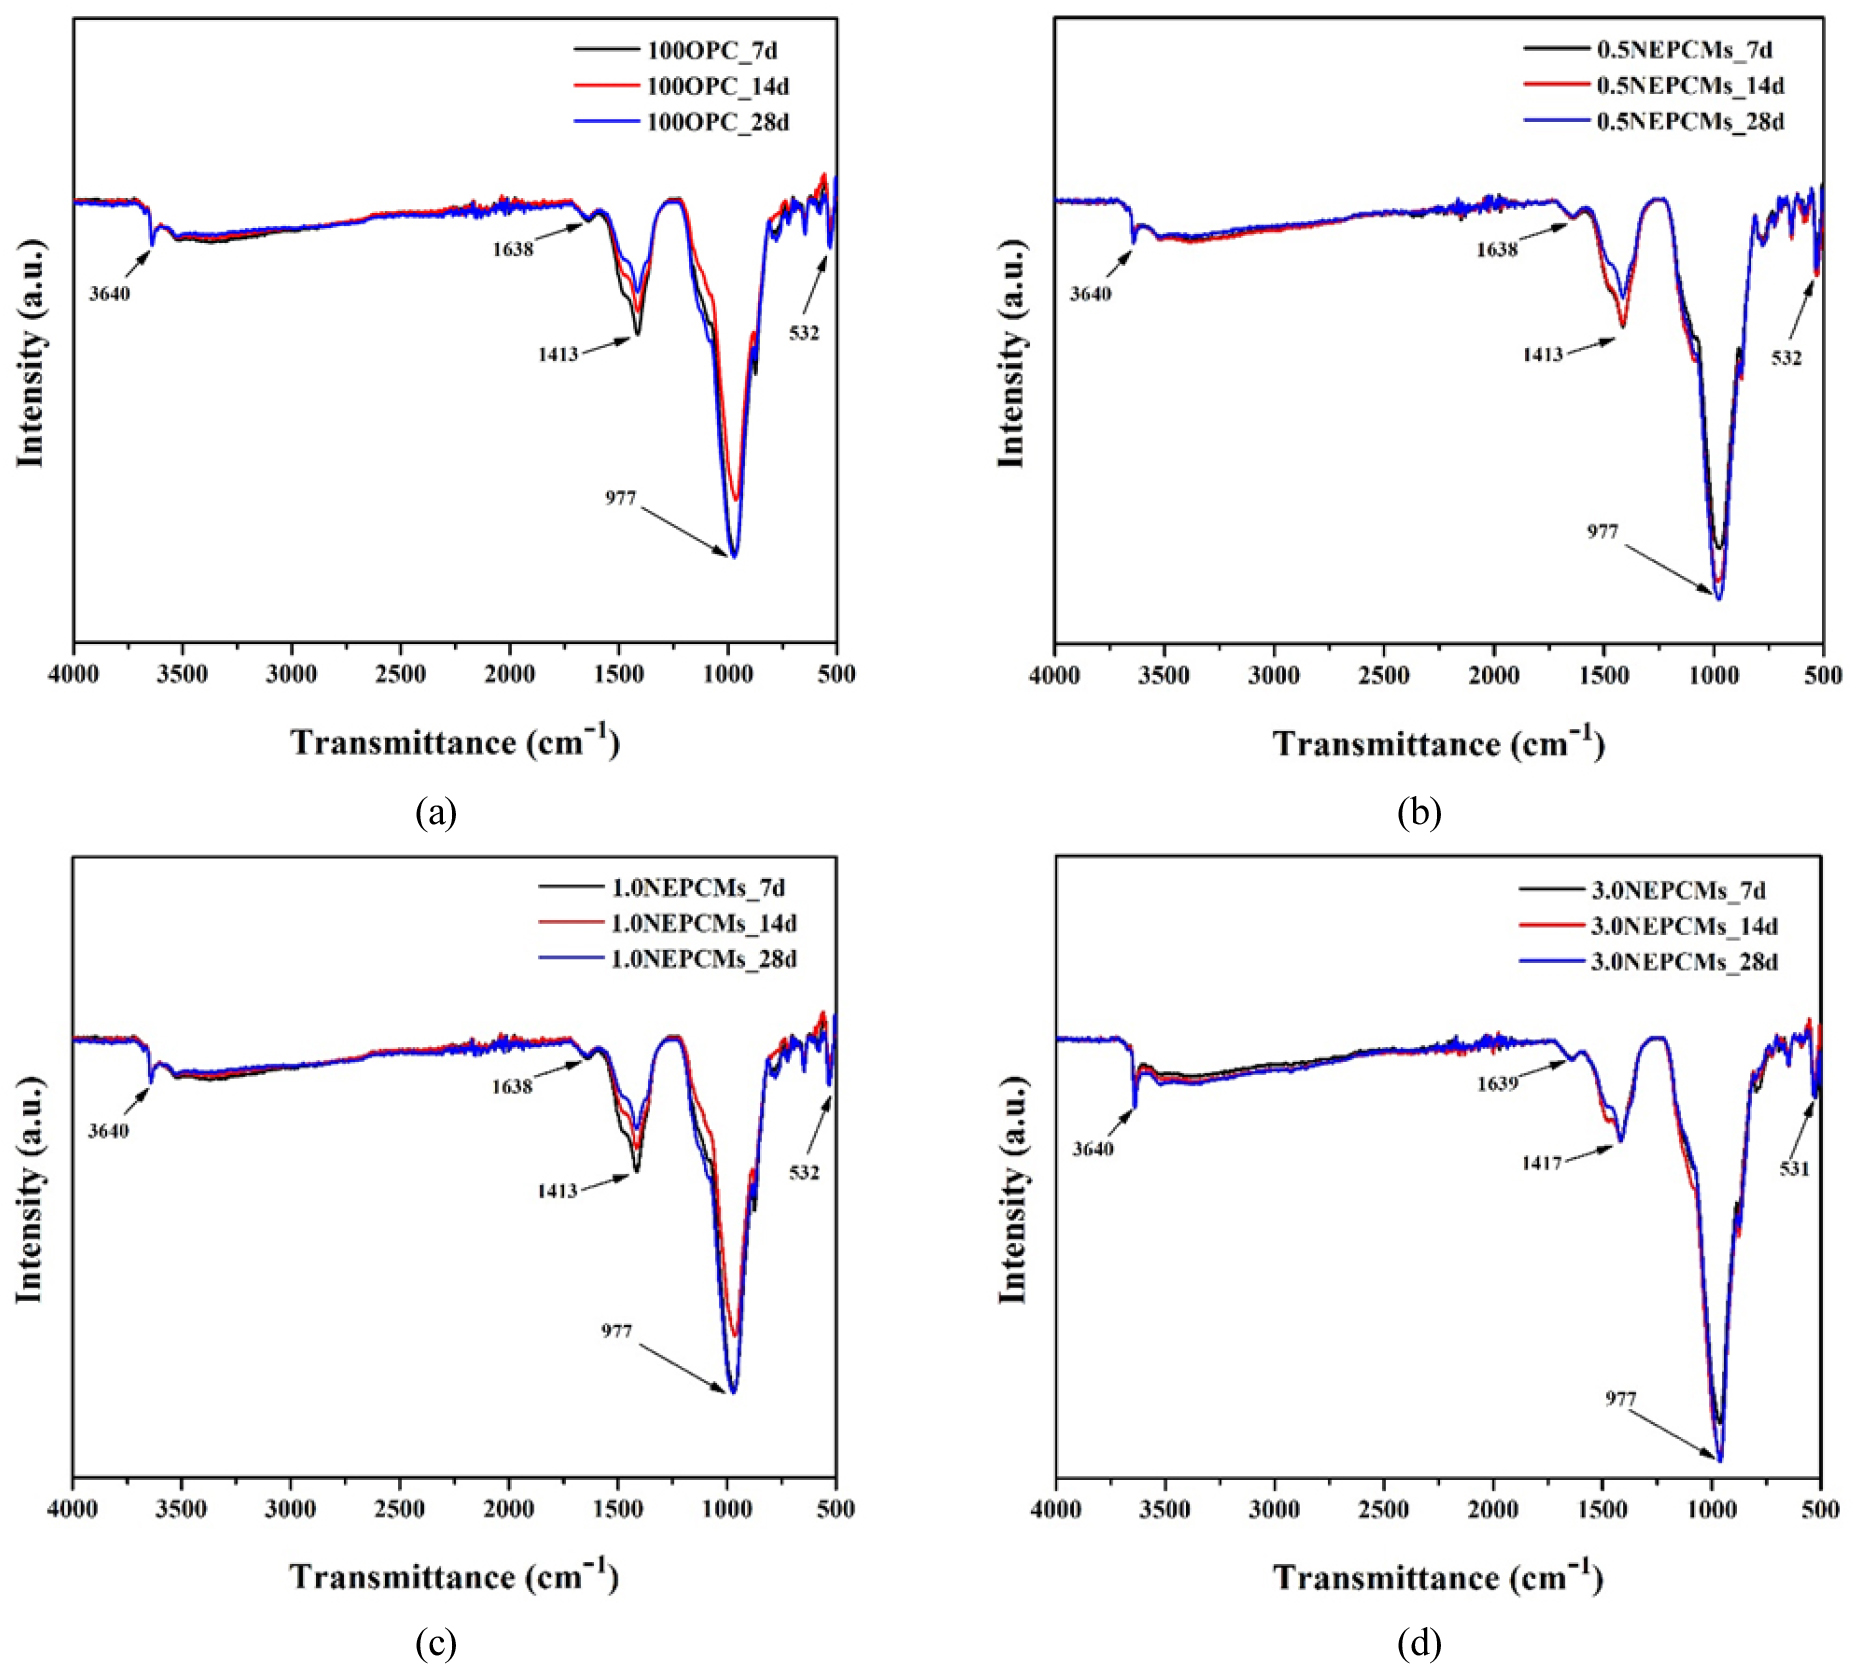
Figure 5 shows the FT-IR spectrums of 100OPC, 0.5NEPCMs, 1.0NEPCMs, and 3.0NEPCMs after 7, 14, and 28 days of curing duration. The position of the absorption peaks are nearly similar in all samples with a very slight change in shape and intensity. The absorption band at 646 cm-1 is assigned to the formation of ettringite [20, 21] whereas strong Si-O stretching vibration appears at 977 cm-1 is attributed to the formation of crystalline phase of C-S-H gel [20, 21]. Apart from that, the stretching and bending vibration of CO32- are observed at 1413 cm-1. The small peak at 3640 cm-1 is attributed to the stretching vibration of the O-H group from calcium hydroxide as well as the bending vibration of water molecules at 1638 cm-1[20, 21, 22]. According to Figure 5(d), the intensity of Si-O peak at 977 cm-1 is high associated with the amount of high percentage of NEPCMs inside the cement system.
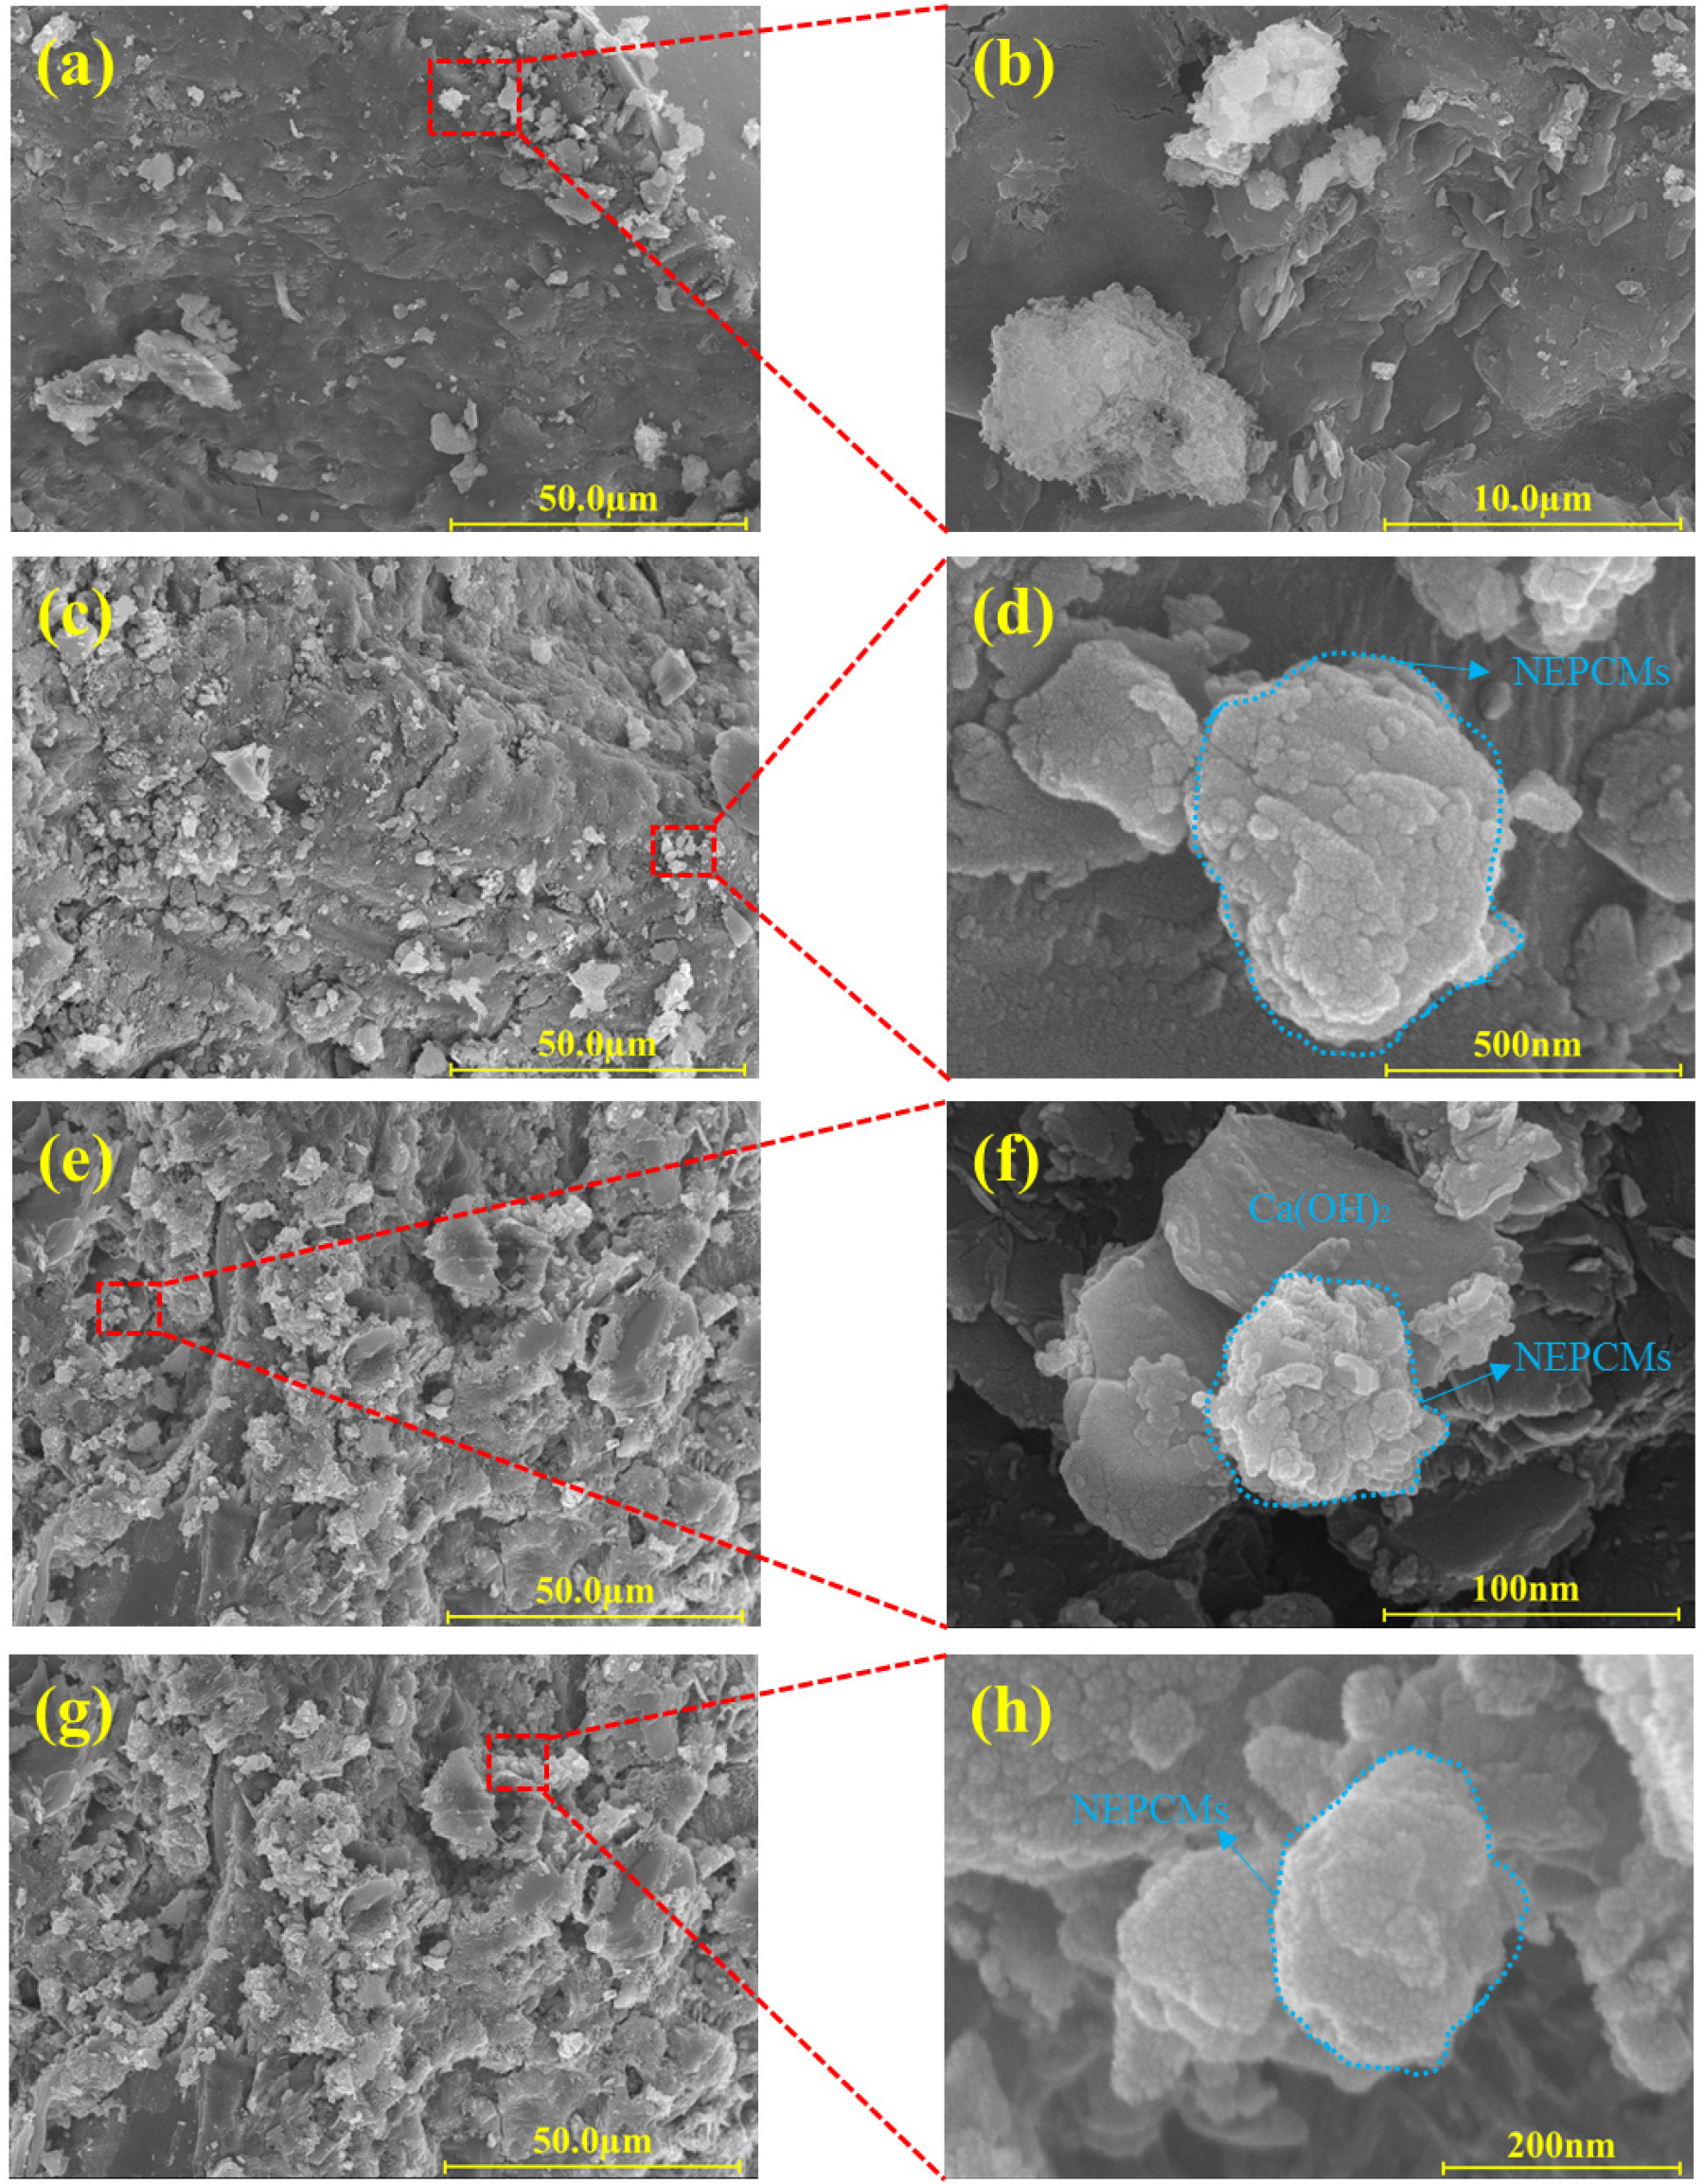
The morphology of the 100OPC, 0.5NEPCMs, 1.0NEPCMs, and 3.0NEPCMs samples after 28 days of curing duration are presented in Figure 6. As we can see in Figure 6(a), the 100OPC sample exhibited a dense structure of the hydrated products which corroborated with good compressive and tensile strength results. With the addition of NEPCMs, the uniform distribution of the PCMs is shown in the micrograph without the breakage of the shell wall. Addition up to 3% of the NEPCMs, the structure of the NEPCMs remain good. In comparison with the study from Hunger et al. [7] which resulted in the leakage problems of the encapsulated PCMs inside the cement system, our synthesized NEPCMs shows good durability and strength after 28 days of curing duration without the sign of the leakage of the core material.
Conclusion
The nanoencapsulated phase change materials (NEPCMs) with dodecanoic acid as core material and silicon dioxide as the shell material are fabricated using a simple sol-gel technique. Concrete specimens are cast with different addition of NEPCMs i.e., 0.5, 1.0, and 3.0% into the cement system. All the concrete specimens are cured inside the water at 7, 14, and 28 days. The compressive strength of the 0.5NEPCMs concrete shows a reduction of 7.9 and 15.6% of both compressive and tensile strength, respectively. Apart from that, the water absorption rate of the 0.5NEPCMs shows an appropriate value of 2.91% compared to the control sample of 100OPC sample (2.89%). Once the amount of the NEPCMs is increased to 1.0 and 3.0%, the absorption rate is increased to 3.04 and 4.46%, respectively. Furthermore, 3.0NEPCMs shows a reduction of the maximum heat release by 45% with a total heat reduction of 55 J/g. The SEM images of these NEPCMs revealed durable and strong protection of the core materials where there is no leakage found after 28 days of curing duration which confirmed that these NEPCMs is suitable to be used inside the concrete matrix.
