

Introduction
Preliminary Study
Robustness of Schedule
The Fundamentals of Critical Chain Scheduling (CCS)
Safety Time Estimation in CCS
Monte Carlo Simulation
Methodology
Questionnaire to investigate scheduling practices in planning phase
Activity Network Conversion
Parameter for disturbance
Experiment
Network generation
Results and Discussion
Conclusion
Introduction
For construction project planning and management, scheduling is a crucial challenge. Construction projects are always undertaken in an uncertain environment and include numerous tasks [1]. Uncertainties can raise the risk of an overall duration delay and schedule mismatches between actual and desired schedule, and can introduce schedule management challenges to support site operation due to factors such as material transportation delays, additional activities, unfavorable geology characteristics, mechanical failures, and resource shortages [2, 3]. Thus, it is crucial to establish a robust construction project schedule to mitigate disturbances and ensure project completion as stipulated in the contract [4].
The critical path method (CPM) is traditional project schedule management technique representing only a single scenario of an actual schedule, thus making it difficult to accommodate the dynamic schedule scenarios found in relation to various events [3]. CPM is a purely deterministic technique that makes it difficult to attempt to handle or quantify uncertainty [5]. In addition, with CPM, it is difficult to establish a reasonable schedule because uncertainty is not controlled. Each activity has a contingency against uncertainty, but it is often consumed by factors such as the last-minute syndrome and Parkinson’s law, as there is no distinction between the required time for substantial work and the time buffer of an activity [6]. Therefore, as construction projects become larger and more complex, effective project scheduling tools are needed to accommodate the increasing level of uncertainty and the dynamics of the construction process [7]. The effectiveness of the schedule of a construction project to mitigate the negative effects of uncertainties is determined mainly by its robustness [8].
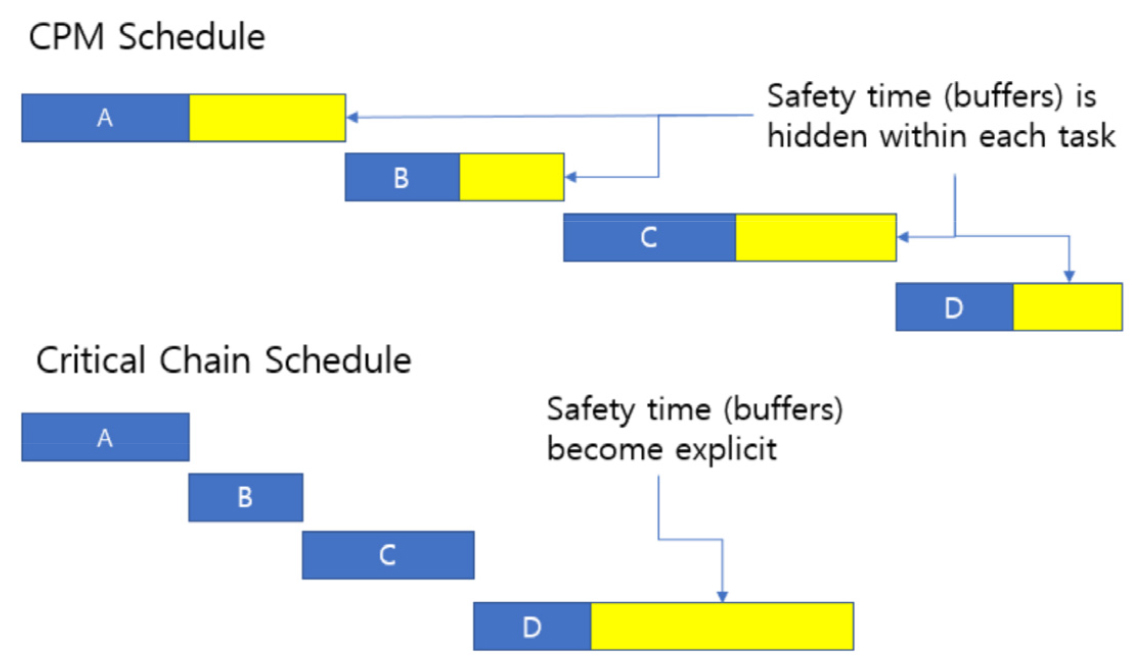
Critical chain scheduling (CCS) has received considerable attention over the past few decades as a proactive scheduling strategy [9]. To prevent project overruns and properly handle schedule performance expectations against uncertainty, CCS provides a reliable schedule using a buffer management strategy [10, 11]. CCCS does not assign a specific amount of safety time to each activity. It develops the schedule by means of a targeted activity duration estimation with a 50% confidence level [12, 13, 14]. The safety time accumulates from critical chain activities and is relocated to the end of the chain as a type of buffer to absorb any chained delay [2, 14]. The buffer is resilient to schedule fluctuations and can accommodate a diversity of unexpected scheduling events [15]. By combining the individual implicit buffer with an explicit buffer, the explicit buffer in this case defends against activity delays stemming from the last-minute syndrome, delaying the start time of tasks and against Parkinson’s law, which can induce work expansion by workers.
However, given that CCS was initially developed for the industrial engineering domain as a management method for coping with uncertainty [16], it is still controversial as to whether CCS is an appropriate method for the construction industry [13, 17]. There are two few empirical studies to demonstrate clearly the actual effectiveness of CCS when applied to the construction industry. A few studies have attempted to apply CCS to the construction industry [14], but they failed to account for the variety of construction activities and the actual scheduling mechanisms used in practice [18]. Previous studies adopting CCS for construction projects were insufficient with regard to validating the practical and smart application of CCS, as they did not reflect the level of uncertainty and the scheduling approaches actually used in the construction field, despite the fact that CCS is a feasible option for preparing for uncertainty.
Therefore, in this study, we employ CCS in the planning phase of construction projects while taking into account its schedule management approaches. In addition, the robustness of each schedule generated by CCS was examined and compared. Robustness is defined as the ability to cope with uncertainty. To do this, questionnaires from practitioners were used to examine the practice uncertainty level of activities and the duration estimate process, and a Monte-Carlo simulation model was developed to compare the performance capabilities of schedules generated by CPM, traditional CCS, and the proposed CCS.
As a result of this study, it was proven that when applying CCS to construction projects, numerous uncertainties in the construction activity and construction practices should be considered. In particular, when removing the safety time from activities to calculate the size of the buffer, it is necessary to consider assumption differences between CCS and construction schedule management. Also, applying critical chain scheduling to construction projects can be developed as a basic tool.
Preliminary Study
Robustness of Schedule
Traditional research dealing with project schedules typically tries to reduce the project makespan and optimally level the resource usage over time [3]. However, these highly optimized schedules are vulnerable to small changes. Even a trivial disruption in delays or resource availability during a predefined schedule period will have a significant influence on the execution dates of all activities scheduled in the following periods in such a tight schedule [19]. In other words, the schedule is not robust. Nonetheless, rather than minimizing the anticipated project duration or other regular objective functionality, the establishment of a precalculated baseline schedule with the goal of ensuring consistency in the start and end dates of the activities has been generally disregarded so far [20].
As a result, during the last decade there has been a growing interest in robustness to protect baseline schedules. The term “robustness” refers to a schedule’s performance to withstand disturbances as much as feasible throughout project implementation. Critical Chain Scheduling (CCS) is a proactive and smart planning technique to build project baseline schedules that are adequately maintained from uncertainties provoked by unpredictable activity durations and resource availability.
The measurement of robustness often used can be distinguished into two types, quality robustness and solution robustness [21]. The stability performance of the entire schedule measured as quality robustness. Project duration, namely makespan, project tardiness and earliness, and the probability of in-time completion are all frequent objective functions in a project environment. The expected return values of the objective function, such as the estimated makespan, can be used to assess quality robustness when stochastic data is presented [22]. This measure’s analytic assessment for a certain schedule should be recognized. Meanwhile, the discrepancy between the baseline and the actual schedule is referred to as solution robustness. This difference can be assessed in several ways for a certain execution scenario, such as the difference between the planned and actual activity start timings, the number of disturbed activities, and so on [21, 22]. By their definition, we define solution robustness in this study as the difference between the planned and actual schedule in each activity.
The Fundamentals of Critical Chain Scheduling (CCS)
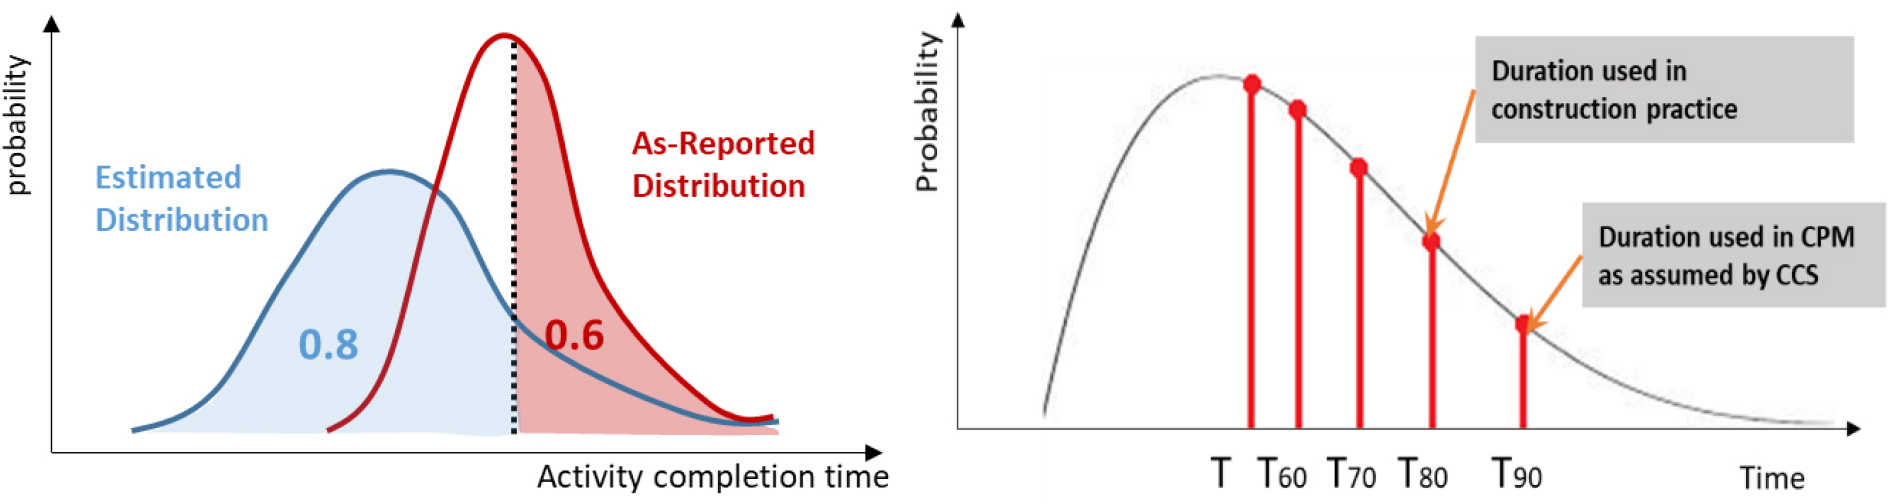
One of the most major issues in current construction project planning techniques is project delays. CCS has been deployed as a project management method to avoid this critical challenge. At the task level, this method avoids the primary impact of last-minute syndrome and Parkinson’s law [23]. To lessen the effect of Parkinson’s law, CCS constructs the schedule with duration estimate of activities on a 50% level of confidence [14, 24]. These durations are approximated regardless of activity due dates by eliminating multitasking [24, 25]. As a buffer, the sets of eliminated safety time are inserted at the end in the form of a buffer (Figure 1). The perception that there is a time limit will be corrected by stated estimates. As a result, employees work harder to complete work in time, which leads to the elimination of multitasking [25].
In order to overcome this phenomenon, CCS recognizes the critical chain in the following four steps [25].
(1)Determining the timespans. Under the mentioned conditions, project managers should give each activity a suitable amount of time.
(2)Progression of activities. Each activity is pulled forward as much as possible. A factor to consider is whether the precedence relationships between the activities are maintained.
(3)Dealing with resource overabundances. It’s one of the most important elements toward determining a workable schedule.
(4)Buffers must be set. Each buffer is placed at a specific location in this stage.
The longest chain of dependent constraints is referred to as a critical chain. Because they require the same resources, any dependencies between activities must be taken into account when determining the critical chain [25, 26, 27]. Tasks are moved early in-time to resolve resource conflicts [12]. According to [14], the critical chain is the longest connected chain determining the project lead time.
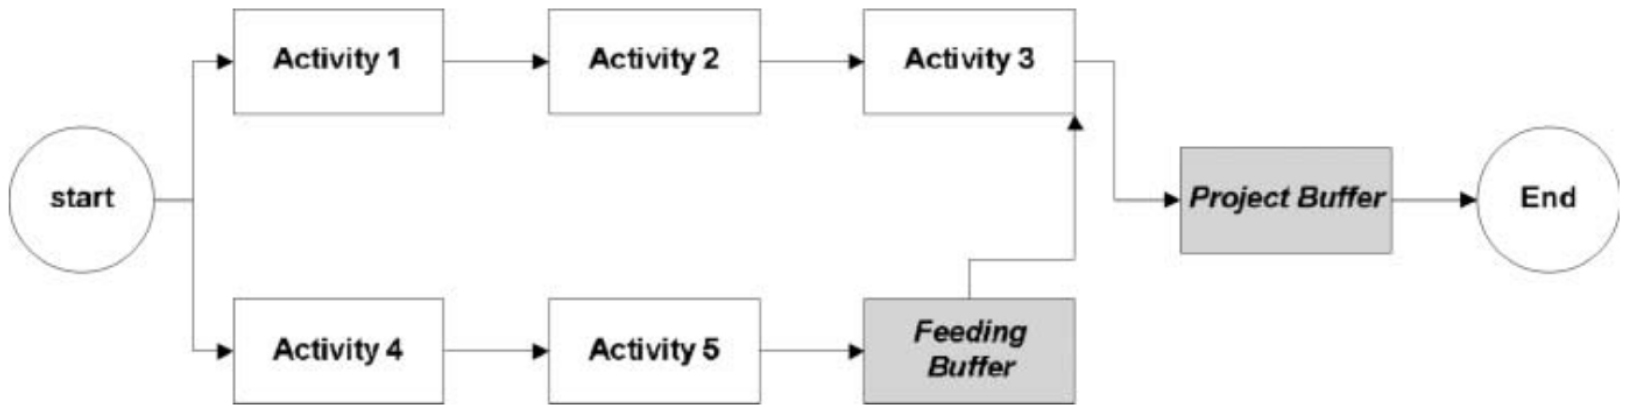
Instead of using durations with implicit safety time, the mean of activity durations is employed. The difference in length between these two types of activities in the critical chain is transferred to the project’s end as a project buffer (Figure 2). This buffer strives to maintain that the completion date is not exceeded. It is not uncommon for a project manager to use only a part of the project buffer or none at all. Because there are multiple chains in real projects, CCS anticipates a buffer to preventing the chains from being delayed. This buffer, known as a feeding buffer (Figure 2), is located where a non-critical chain activity connects to the critical chain. Finally, these buffers prevent critical chain processes from being disrupted or starting late [14, 25].
Safety Time Estimation in CCS
In order to extract the safety time from each activity, the size of the safety time must first be calculated. [29] defines safety time as the difference between the duration of 90% and 50% confidence level in the CCS that is ‘Safety Time’ = t (90%) – t (50%) (Figure 3).
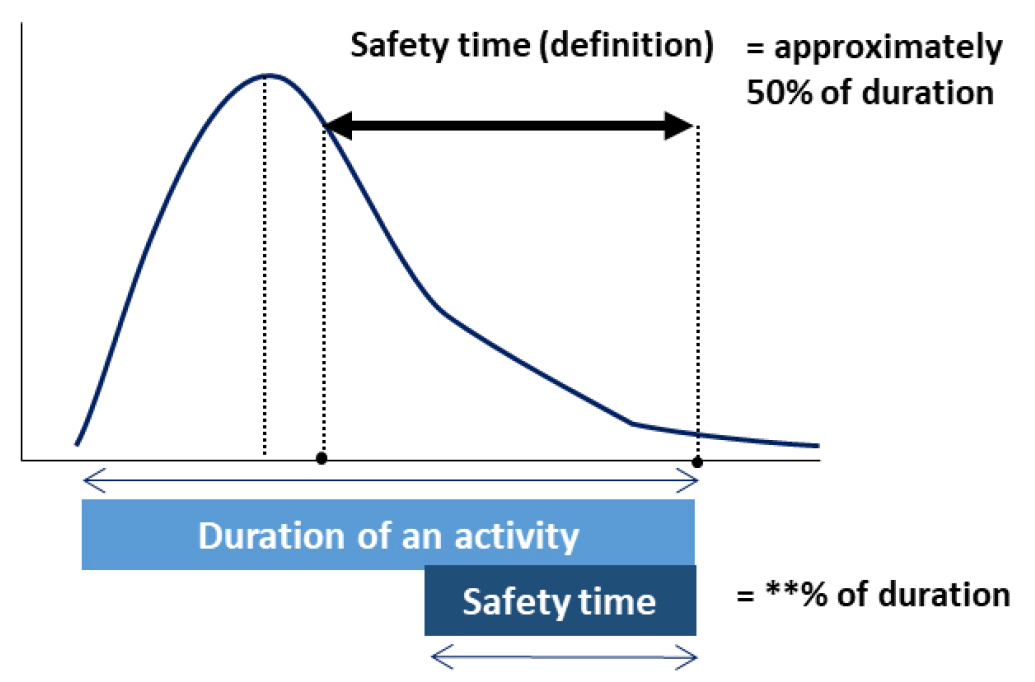
However, the majority of research has used the rule of thumb to simplify safety time calculations depending on a fixed right-skewed probability distribution of activity duration [11, 14]. Even in the cast of studies that apply CCS to construction, they have assumed that safety time accounts for 25 to 50% of duration [30]. Japanese project cases [31] also used the rule of thumb as the main estimation method. On the other hand, other studies that have tested the applicability of CCS were able to prove the performance without worrying about the estimation method, since it was generally assumed that the size of the safety time was already known.
However, the fundamental flaw in using the rule of thumb method to estimate the average completion time of activities is that it ignores the level of uncertainty in various activity types [11]. Because various activities of construction projects have different uncertainty, the larger the uncertainty, the greater the error. Therefore, it is vital to represent the numerous activities and period calculation methodologies utilized in construction work in order to apply CCS to construction projects appropriately.
Monte Carlo Simulation
For nuclear weapons programs in the 1940s, von Neumann, Ulam, and Metropolis devised the Monte Carlo methodology [32]. It uses probability and statistics theory to obtain random numbers from a certain probability distribution [33].
It is well suited to the description of systems with large stochastic variability. Because simulation models can accommodate the stochastic unpredictability of numerous parameters, the examination of simulation outcomes provides important insights into how the actual system would behave under the schedule’s robustness being evaluated, resulting in an assessment of the schedule’s robustness [34]. Therefore, when applying CCS to construction, monte-carlo simulation is suitable for measuring robustness and investigating its changes [35]. It makes it possible to consider not only the robustness of total duration but also that of individual activity.
Methodology
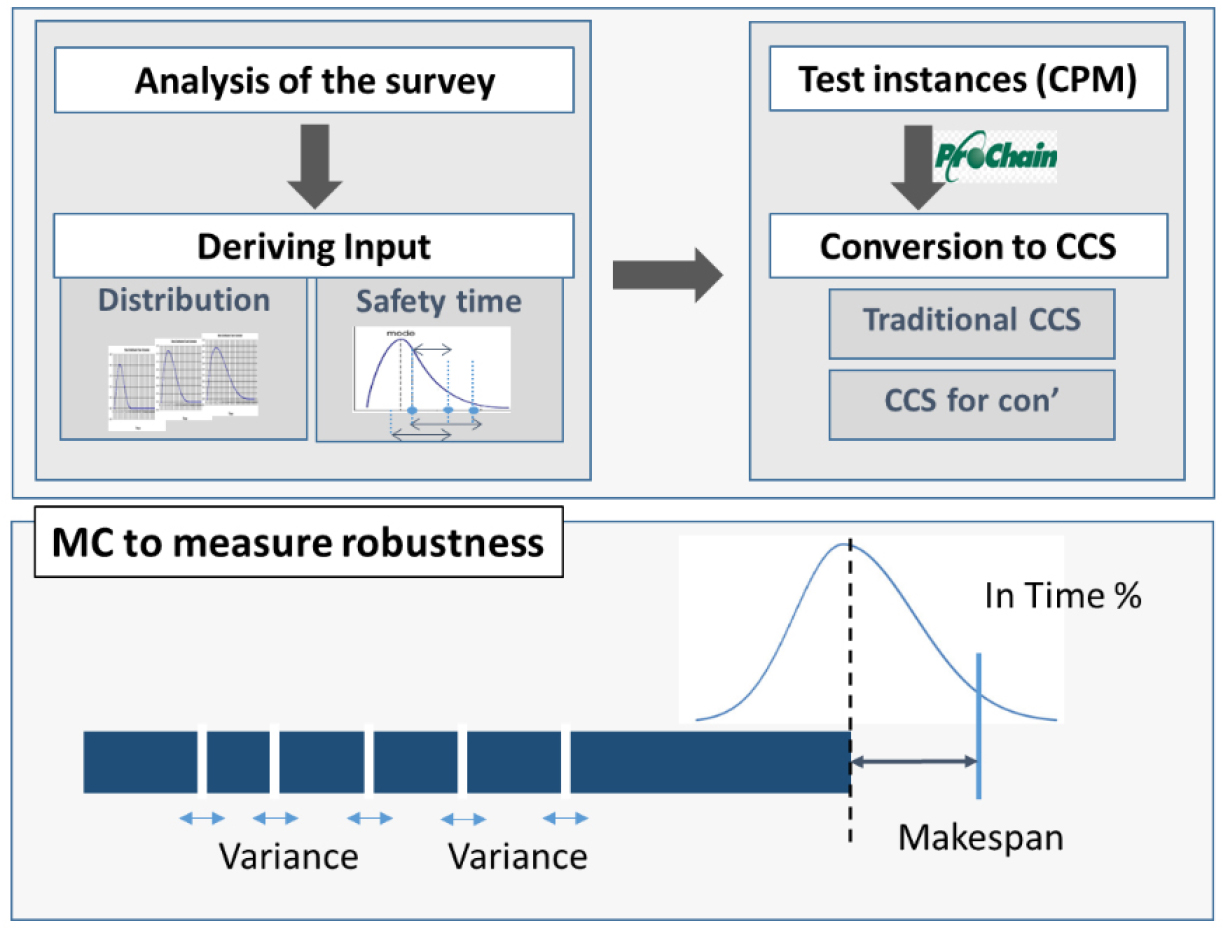
In this chapter, we developed a monte-carlo simulation model considering scheduling practices in construction projects. First, through a questionnaire, tendency of the executed schedule, duration estimates process and various distributions of activities in construction were surveyed. The simulation model was built on the results of the questionnaire. Reflecting the events in the construction field, inputs were derived and the safety time was redefined. Also, the performance of the schedule from the output of the model is evaluated in terms of robustness that are ‘in-time completion probability (%) ’, expected makespan (project duration) and mean of difference between the finish date of each activity (weeks) (Figure 4).
Questionnaire to investigate scheduling practices in planning phase
The objective of the questionnaire is to investigate activity duration estimation methods in practice and derive the input value to use in the experiment as follows
(1) The discrepancy between the planned schedule and the implemented schedule
(2) Identification of duration estimation approaches of construction projects
(3) Identification of various distributions of activities in construction
The survey is largely divided into planning and construction phases. The first part is to inspect the field manager’s practice of project scheduling and the severity of scheduling issues during the planning phase. The other is to investigate how often it occurs and what causes differences in plan and actual and problems caused by them in the execution phase.
The questionnaire was open-ended and on a 5-point scale and multiple choice, and received from 26 employees working at engineering and construction company D, S, and P. The survey included 12 employees with a career of less than 10 years, 6 employees with 10-20 years experience and 8 employees with more than 20 years experience.
According to the questionnaire, the estimated completion probability of activity at the project planning phase was 80% and the actual completion probability of activity was 13% of ‘in-time’, 27% of ‘at the given time’ and 60% of ‘out of time’ completion. One of the major reasons is Last-minute syndrome and Parkinson’s law, which scored 2.9/5.
This result indicates that the safety time assigned to each activity is often consumed by Last-minute syndrome and Parkinson’s law [6]. This schedule difference makes it hard to manage a project as causing resource relocation problems, communication problems. This Last-minute syndrome and Parkinson’s Law are a parameter that affects the input and is reflected in the monte-carlo simulation (Figure 5).
Also, as a result of the questionnaire survey, construction practitioners estimate duration with a completion probability of about 80% while CCS assumes a completion probability of 90-95% in order to ensure sufficient time to complete. It is due to efforts to shorten the time required to secure competitiveness for bidding. This practice also affects the process of converting existing schedules to CCS and the size of the safety time (Figure 5).
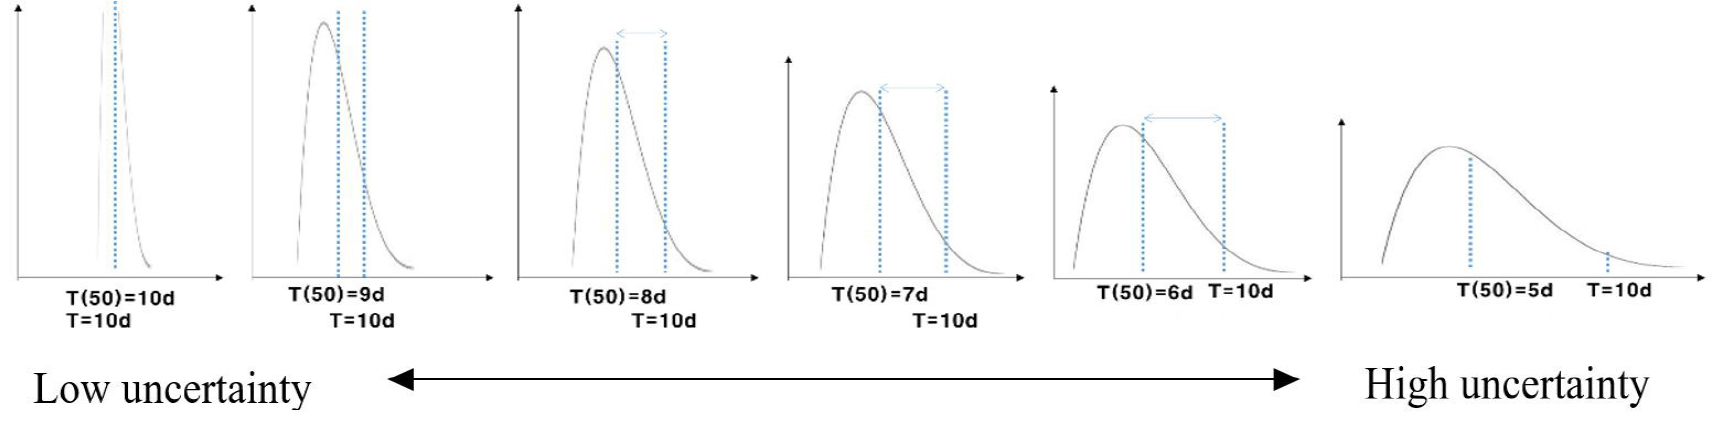
Finally, through the survey, the ratio of activities for construction projects according to the degree of uncertainty was identified (Table 1). Obtaining information from the project executioner about the safety time implicit in the calculation of each task’s duration is one of the most required aspects of CCS. The ratio of activity according to the uncertainty level derived here was used to generate the network in the simulation model. There was a limit on the number of activities possible and the reliability of the survey was not high, so we do not follow the ratio absolutely, but only reflect the tendency.
Table 1.
The degree of uncertainty in activities and its distribution
Activity Network Conversion
In order to examine how well CCS for construction projects copes with uncertainty, we compared to the traditional scheduling method (CPM) and CCS in theory, in terms of robustness, while reflecting the practices of the construction project derived from the previous questionnaire, monte-carlo simulation was used. For the simulation, the results of the questionnaire are parameterized to generate distribution of individual activities, redefinition of safety time, and activity delay by last-minute syndrome and Parkinson’s Law.
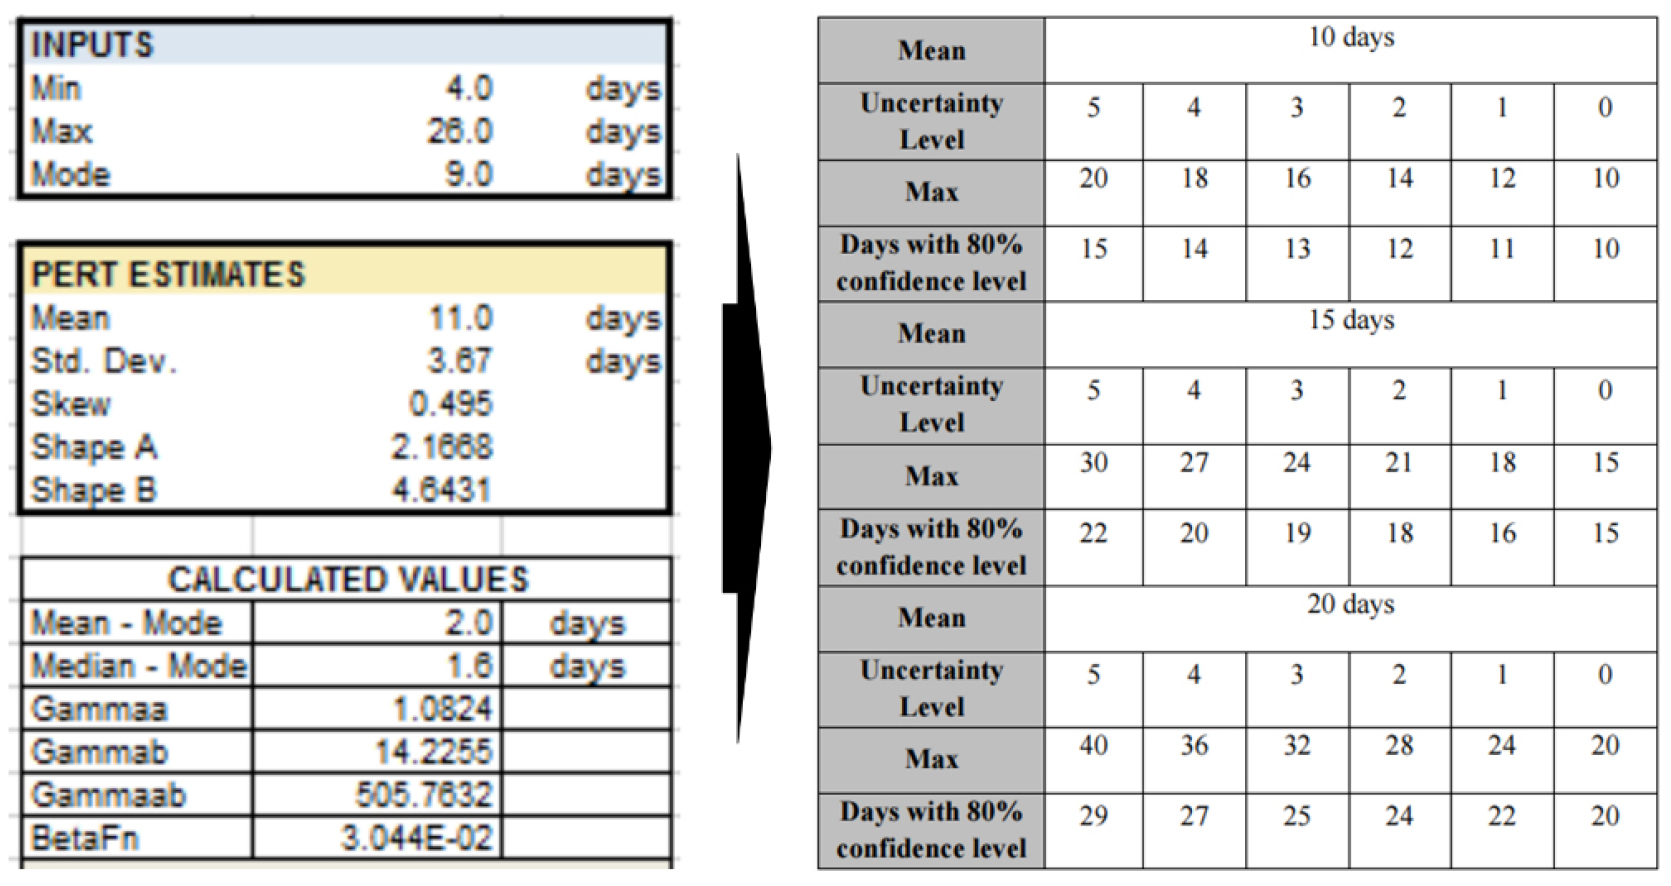
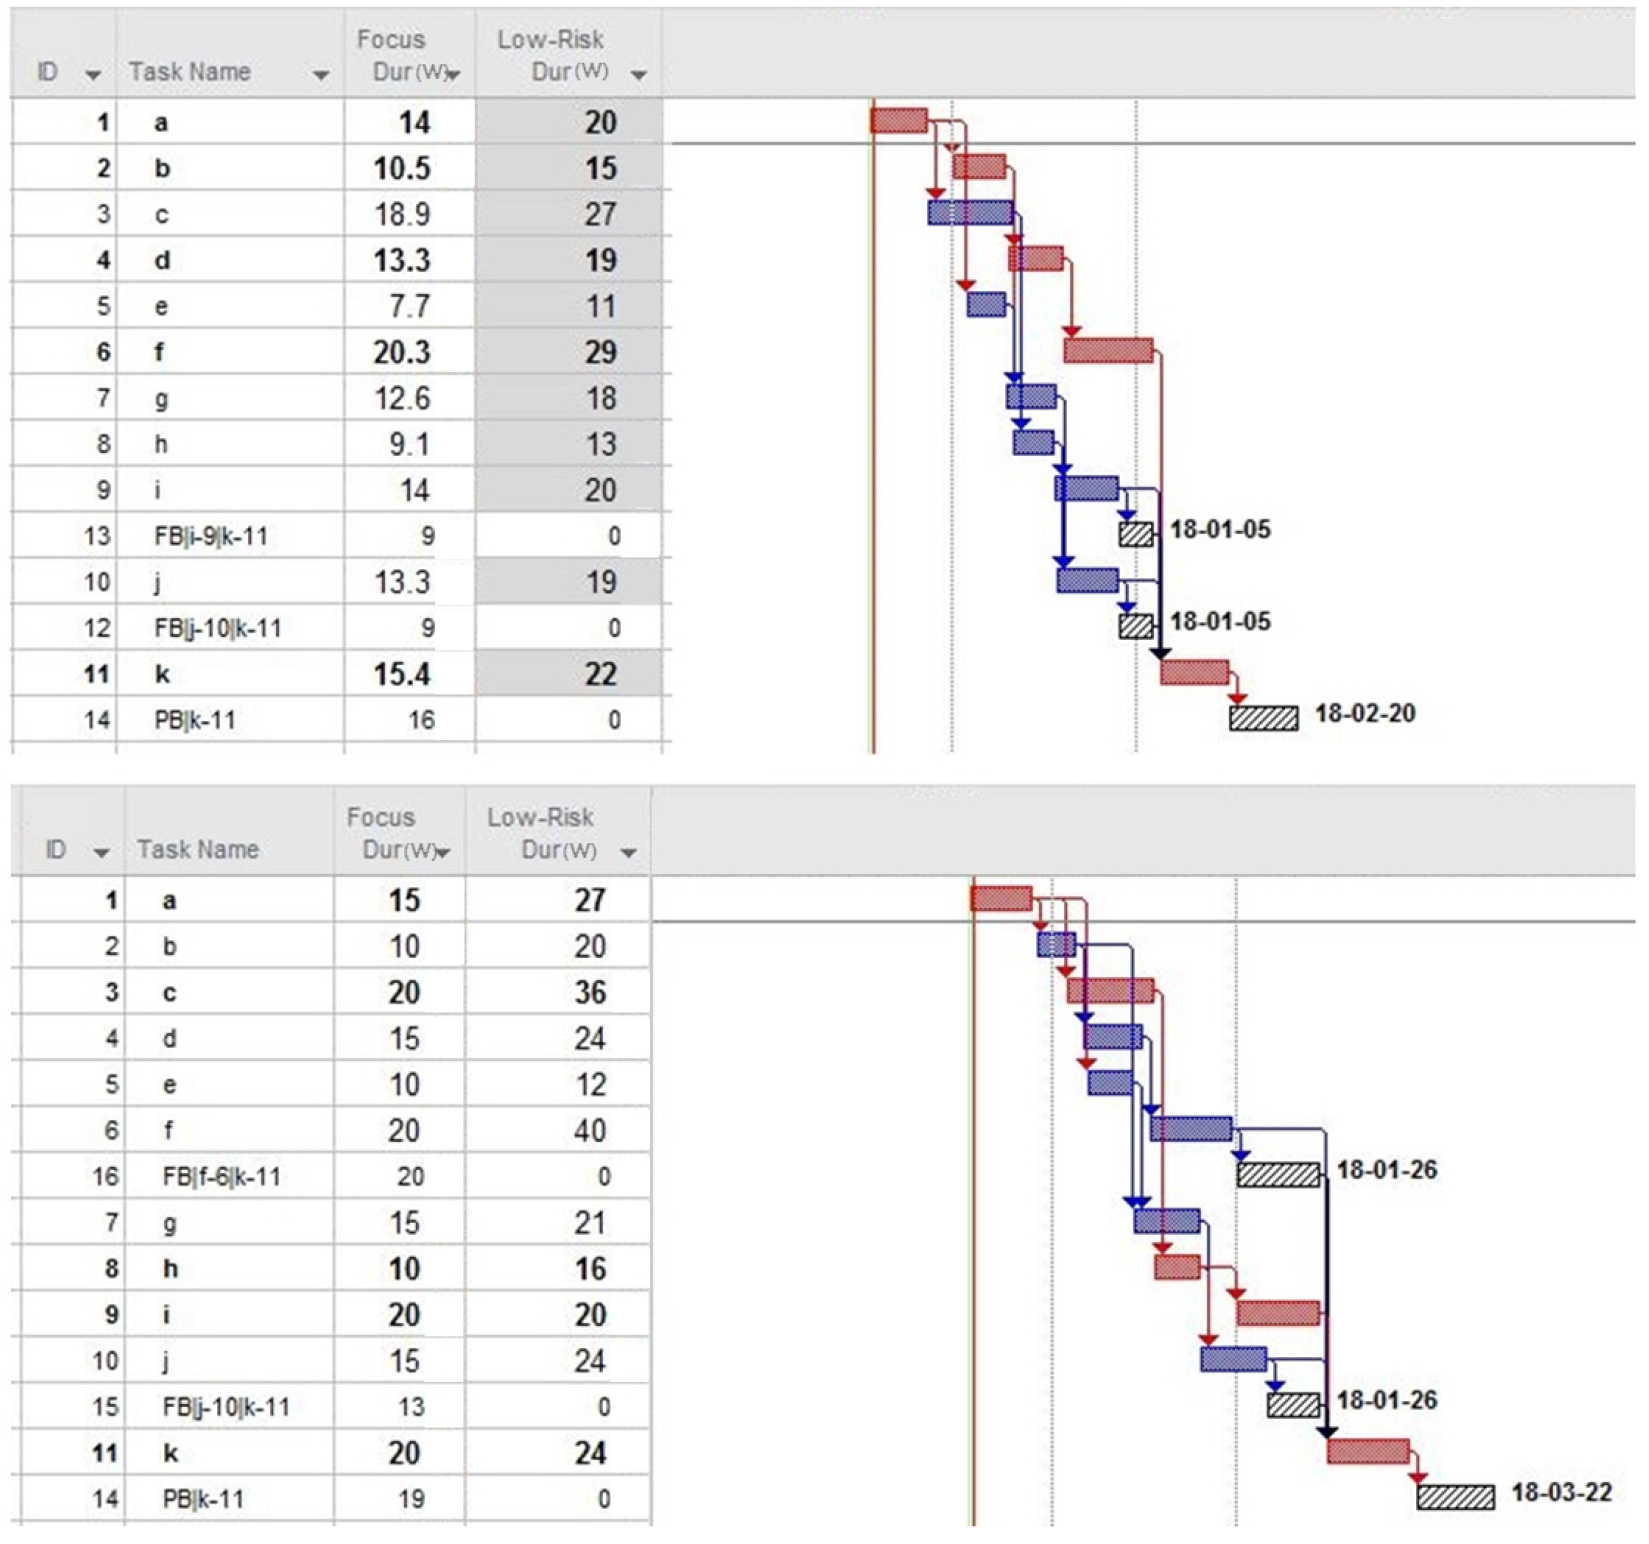
In order to consider the difference in the method for calculating an activity duration in CCS and CPM/PERT, the distributions corresponding to six uncertainty levels in the survey are derived using a beta distribution calculation. With the beta distribution calculator, activity durations of 10 weeks, 15weeks, and 20weeks were derived according to the uncertainty level. The list of activities used in the model is described in Figure 6.
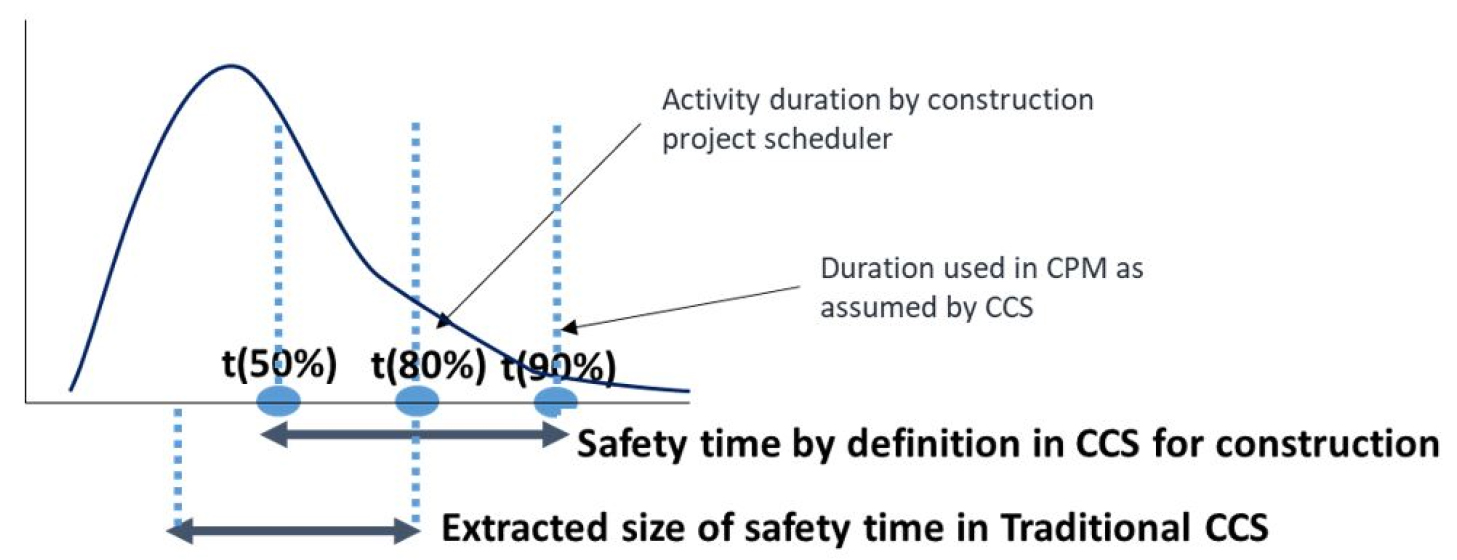
To extract the safety time of an activity from the assigned duration in CCS for construction projects, safety time greater than the intended value is extracted from the activity since the duration estimate used in the construction project is not t (90%) assumed in CCS but t (80%) as shown in Figure 7. When an existing schedule is converted into critical chain schedule, previous studies used the rule of thumb for safety time calculation. The point here is that the rule of thumb is applied at the duration of 80% confidence level, not at 90% confidence level. For example, in an activity with a duration of 10 weeks on a given CPM network 3 weeks are extracted as a safety time and 7 weeks are viewed as the time required for the operation. According to the definition of safety time in CCS, safety time should be extracted from other weeks of 90% rather than 80% of 10 weeks. For CCS for construction, duration with 90% of confidence level and means of beta distribution were used to calculate the safety time.
A probability distribution is assigned to the activity according to the activity ratio obtained from the questionnaire. Activities first constitute the CPM network, and are converted into each CCS network based on the CPM network using ProChain®, which is a schedule planning and decision-making tool that assists with the implementation of CCS concepts. According to the redefinition of safety time above, in traditional CCS, the extracted safety time is 30% of the duration of activity in the CPM network. Meanwhile, in CCS for construction, the CPM network is transformed by extracting the safety time according to the given distribution according to the degree of uncertainty for each activity. The safety time is merged into an explicit form, the buffer, and located at the end of the activity sequenced chain as described before. To calculate the size of the buffer, cut and paste method is applied for buffer sizing since it is known to perform relatively well when the number of activities is less than about 30 [36]. Accordingly, traditional CCS has the same critical route as the existing critical path on the CPM case because the activities are compressed at the same rate. On the other hand, in CCS for construction, the critical chain did not often match the critical path by the redefinition of safety time and duration estimation.
Parameter for disturbance
There are a number of unknowns in the construction process that induce the actual and planned schedules to diverge. Accordingly, disturbance factors in construction projects should be considered when developing a monte-carlo simulation model. We considered these two factors, a delay risk that is difficult to reflect in advance and a delay caused by an unspecified buffer as the schedule disturbance of this simulation model. The rate of disturbance incidence was set at 10% by a numerical experiment on 120 test instances [37]. At CPM, last-minute syndrome and Parkinson’s Law are reflected in the given schedule at 8% probability.
Finally, with the parameters described above, activity networks were simulated numerous times to evaluate the robustness of the network. Through monte-carlo simulation, we evaluated and compared several baseline schedules of CPM, traditional CCS and CCS for construction projects, which are rearranged in this research. The measure, makespan and robustness, can be computed to determine how well CCS performs against uncertainty as defined above. The schedule would be more robust the lower the variability. The robustness is demonstrated in in-time project completion probability (%), expected makespan (project duration) and the mean of difference between the finish date of each activity (weeks) as a simple measure of robustness.
Experiment
Network generation
According to the given network structure, a CPM schedule is first generated and converted into CCS. The precedence relationships and probability distributions of activities, including duration and uncertainty level on the schedule are set arbitrarily. In the CPM network, activity duration was set at 70% completion probability within the period as investigated above. The start and end of the activity were calculated in the forward pass method according to the activity period and the set precedence relationship, and the project duration is the same as the time when the last activity ends. An example of the schedule constructed in this way is shown in Table 2. For this experiment, 5 project schedules with 11 activities are randomly generated to be simulated.
Table 2.
Activity duration and precedence relation of a generated CPM network
The cut and paste method is used to calculate safety times for each activity in the CPM network, then they are clustered together as feeding buffer and project buffer and located at the end of the chain. Traditional CCS and CCS for construction converted using different safety time extraction methods are shown in Figure 8, respectively. In the case of traditional CCS, a network structure similar to that of CPM appears because safety time is extracted by the rule of thumb method, and in the case of CCS for construction, it is shown that the network is converted to a different structure because uncertainty level of activities is considered. With those schedules, the performance and robustness measures are computed as the model is simulated with the parameters, differences between the planned and actual schedule.
Results and Discussion
The Monte-Carlo simulation was executed 1,000 times for each example network (Figure 9). The executive results of a simulation under the given conditions derived from the project make-span and its probability of completion on time from the standpoint of the overall project as a robustness measure (Table 3).
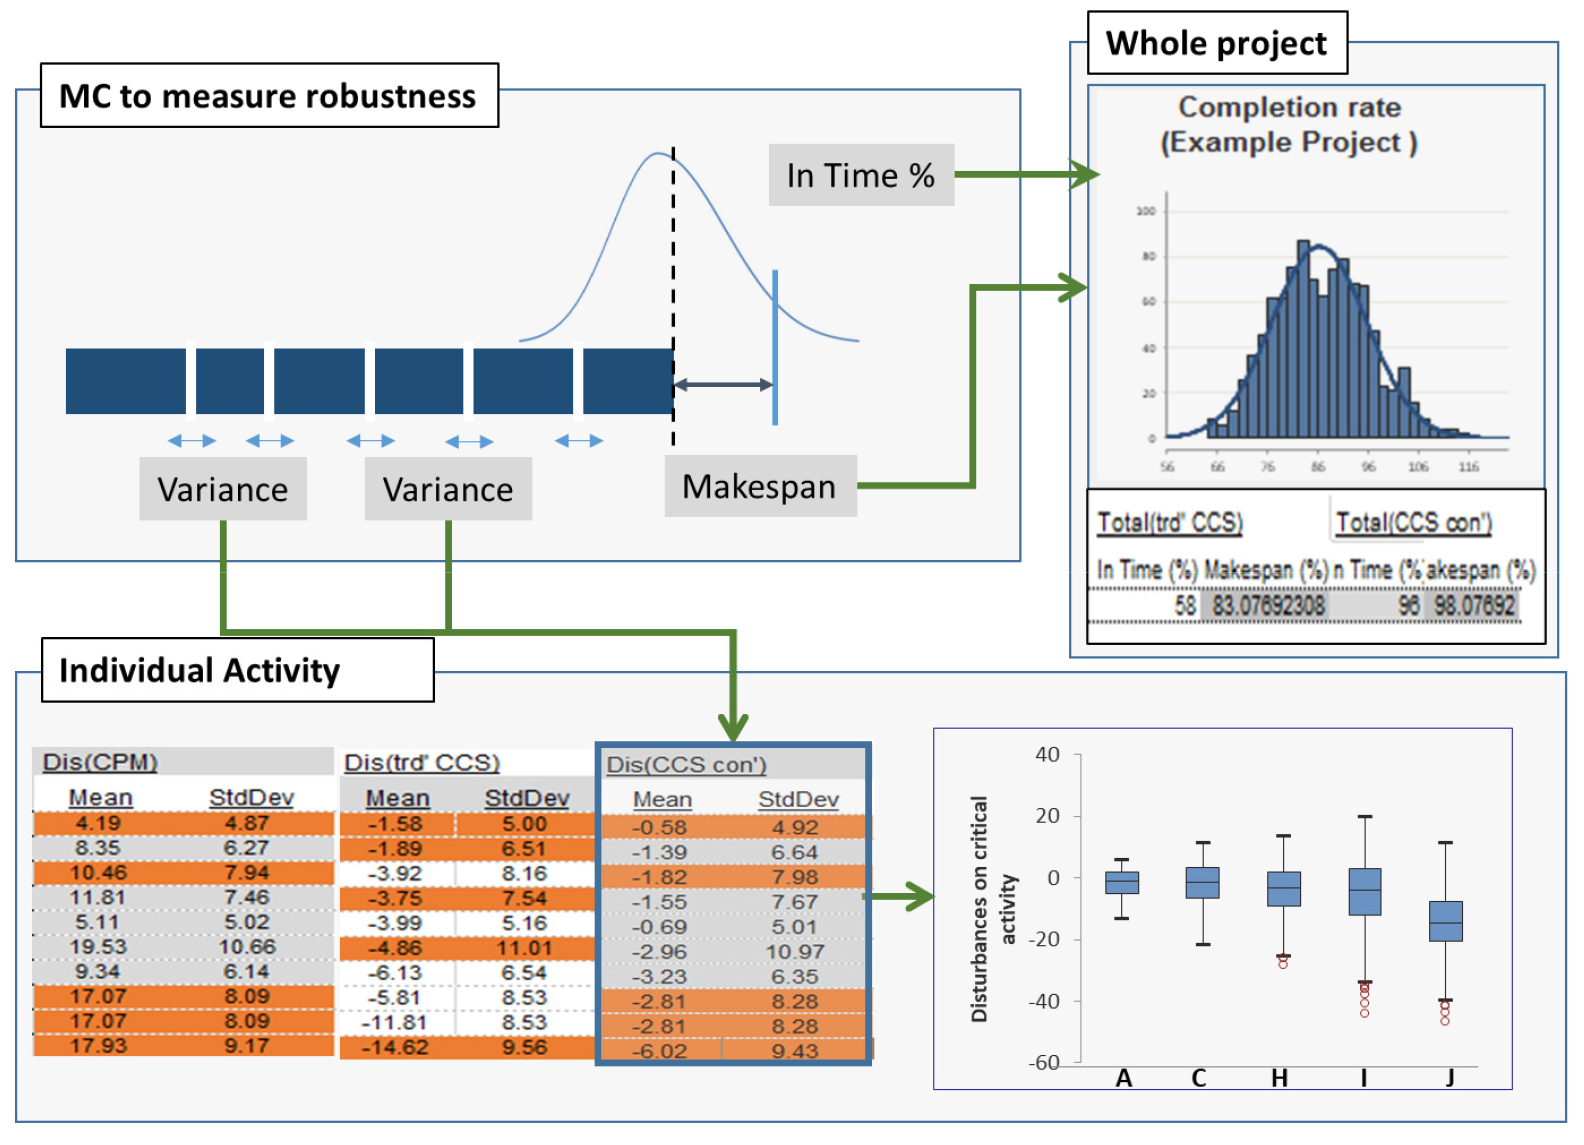
Table 3.
Average of the planned duration and in time probability of 5 networks
| CPM | Traditional CCS | CCS for construction | |||
| Duration (%) | In Time (%) | Duration (%) | In Time (%) | Duration (%) | In Time (%) |
| 100.00 | 85.36 | 84.91 | 46.75 | 100.58 | 94.64 |
A shorter period than the mean is often calculated by 30% of the rule-of-thumb method. Also, the schedule is vulnerable in the event of a small buffer compared to the extracted size because the main point of eliminating the safety time is 80% of the confidence level, but not 90% (Table 4).
Table 4.
Average of as build duration and standard deviation of each activity
The consumption of the project buffer as the project progresses is closely linked to the variation of the detailed schedule. When a certain percentage of the duration is removed from all activities and the buffer is created, the buffer consumption pattern appears as a straight line, as shown in Figure 10. However, if the activity has different uncertainties, it should be represented by a broken line rather than a straight line.
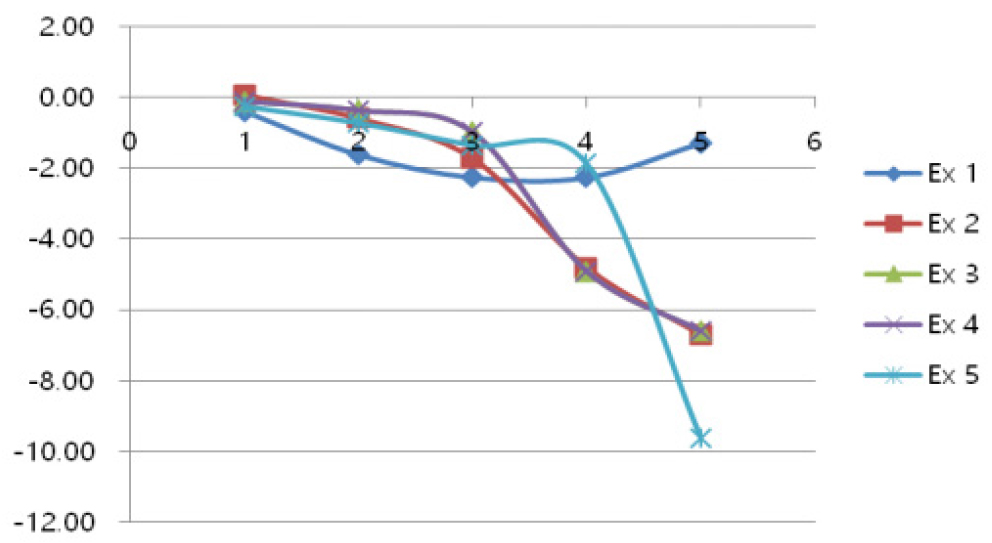
Because the uncertainty of the activities that make up the critical chain of each example differs and the uncertainty of the feeding chain also differs due to the characteristics of the network, it is confirmed by Figure 10 that the graph does not appear as a straight line, instead appearing as a broken line.
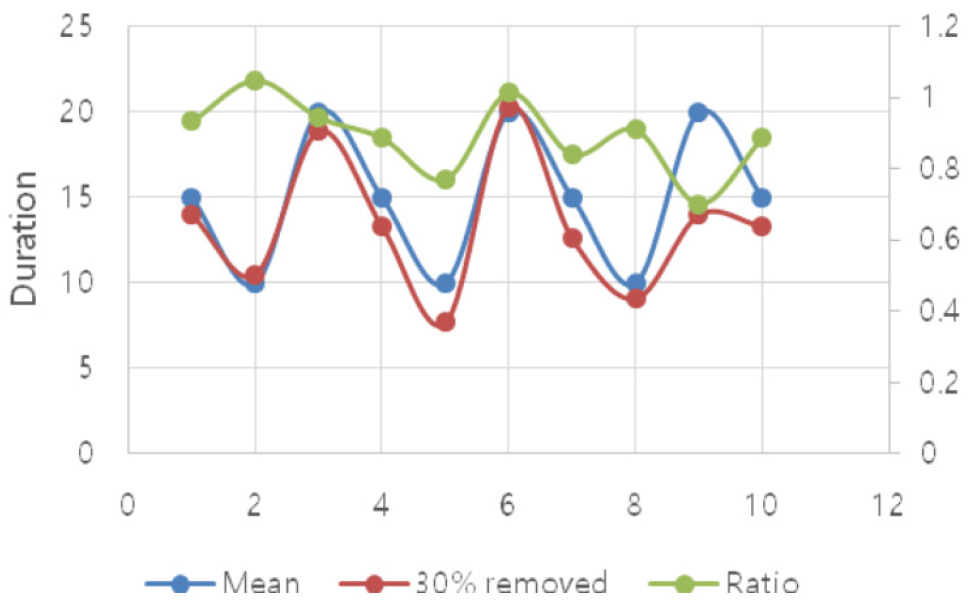
By applying the statistical analysis, according to the uncertainty level of activity, buffer consumption in activities is shown in Figure 11. It can be seen that the graph form changes according to the size and variation of uncertainty of activity. The critical path’s entire time buffer is 19 weeks. The penetration graph is horizontal at this point since the third activity had a deterministic duration with no uncertainty.
Conclusion
The CPM, the most commonly used scheduling method in construction projects, frequently fails to cope with uncertain environments, resulting in project delays. CCS is a potential substitute to build a robust plan utilizing buffers. However, in past studies, only theoretically expected effects were derived because CCS was applied to construction project schedules, and it is theoretically. Therefore, it was difficult to grasp the applicability of CCS to construction projects.
The main goal of the current study was to apply CCS with consideration of construction project scheduling practices and to verify its effectiveness in terms of robustness. The uncertainty levels of activities were investigated using questionnaires and the amount of buffer extraction was considered accordingly. Subsequently, the make-span and the probability of the completion of the CPM method, the theoretical CCS, and the suggested CCS method were compared via Monte-Carlo simulations at the both the activity level and the project level. This study found that the robustness and performance of the critical chain schedule were improved compared to those of the CPM by considering the various uncertainty levels of activities and the practical duration estimation method. In particular, for smart buffer extraction, it should be considered that the completion time of an activity expected by CCS and its actual practical outcome can differ. These findings contribute in several ways by highlighting implications when applying CCS to construction projects and can also provide a basis for an empirical framework to compare the performances of different project scheduling methods when a CPM network is given.
The major limitation of this study is the lack of test instances and the features of schedule networks. The simulation utilized five networks. Considerably more work will need to be done to raise the number of test cases by changing certain input variables, such as the number of activities in the network, the duration of each activity, and the number of degrees of uncertainty. Also, in the CCS research field, numerous studies deal with the features of activity networks, such as environmental uncertainty, activity complexity, and resource availability. Schedule optimization problems and buffer sizing methods depend on these factors. Further research should be undertaken to explore how to deal with these features for better schedule management.
