

Introduction
Modeling and Methodology
Geometry and Beam Detail
Material Properties
Finite Element Discretization
Boundary Condition and Loading
Chloride Diffusion Modeling
Corrosion parameters for FEM
Result and Discussion
Load deflection analysis
Chloride Diffusion Analysis
Comparison of Corroded Beam
Bond stress comparison of Corroded Beam
Conclusion
Introduction
Concrete is currently most widely used building material in the engineering field over a hundred years. To attain a high durability and economical there has been a lot of ongoing research on concrete structure. Steel corrosion in concrete structure is one of the reason for less life and durability [1]. Corrosion of reinforced concrete structure (RCC) in saline areas where the chloride concentration is high. As we know that the concrete is having pores due to this chloride ion can penetrate inside the concrete and slowly reached at the rebar and caused corrosion, not only in saline areas, de-icing salts and many reason are there in environment where the concentration of chloride is high that is caused corrosion. In reinforced concrete structure rebar embedded inside the concrete with nominal cover depth as per country code provision [1]. The cover depth is also matters in the diffusion because if we provide small cover depth then chloride can penetrate early and caused corrosion that why every country have their own code for reinforced concrete structure for different environment.
When fresh concrete is poured around steel reinforcement in RCC structure, the cement paste (cement + water) start a chemical reaction called hydration. Cement react with water and produced a highly alkaline environment that pH value is lies between 12-13. The hydration produces Ca(OH)2 which makes the pore solution highly alkaline and that alkaline condition makes the steel surface form a very thin, invisible protective layer called a passive film. This passive film is made mostly of iron oxide compounds, it is very stable and tightly bonded with steel, because this film is dense and bond well to steel, its block the oxygen, moisture and chloride ions from directly attacking the steel. As long as the concrete stays dense and alkaline, the passive film keeps the reinforcement safe from the corrosion. Once the protective film is damaged, the steel start to corrode, causing rust to form around the rebar and reducing its cross-sectional area. This rust formation and loss of steel are weaken the bond between the rebar and concrete. At first, the rust fills the pores, but over time, as most rust forms, it creates internal pressure in the concrete, which leads to cracking [2].
Many RCC structures are built in corrosion-prone areas, especially in marine environments where the concentration of chloride ions in seawater is very high. In such areas, most failures of RCC structures such as bridges, ports, and parking facilities are due to chloride-induced corrosion. Worldwide, corrosion of reinforced concrete structures (much of it caused by chloride diffusion from seawater or de-icing salts) costs hundreds of billions of US dollars each year. According to reports from the World Corrosion Organization and NACE (National Association of Corrosion Engineers), corrosion in all sectors costs about 3-4% of the world’s GDP [1]. For concrete structures alone, maintenance and repairs due to chloride-induced corrosion are estimated to cost tens of billions of dollars annually on a global scale.
The purpose of this study is to evaluate the accuracy of finite element (FEM) modeling and manual calculations in predicting the load-deflection response of a sound reinforced concrete beam, using experimental data as a benchmark. While several previous studies have focused either on chloride diffusion through analytical models or on purely numerical simulations, this work integrates experi- mental testing, FEM analysis, and analytical methods, enabling direct comparison of all approaches through load-deflection curves [3, 4]. In previous studies, the analysis of beam strength and chloride ion diffusion was done separately. But in this study, chloride ion diffusion, corrosion analysis, and comparison with experimental data are all combined into one model. We examined how chloride ions enter the concrete over the years, how much corrosion occurs based on experimental results, and how the bond between concrete and rebar weakens. The model is also validated by comparing the performance of a sound beam with real experimental results, which shows that it works well. This combined study provides a practical way to predict how an RCC beam will age and lose strength in a chloride environment [3, 4, 5].
Modeling and Methodology
Geometry and Beam Detail
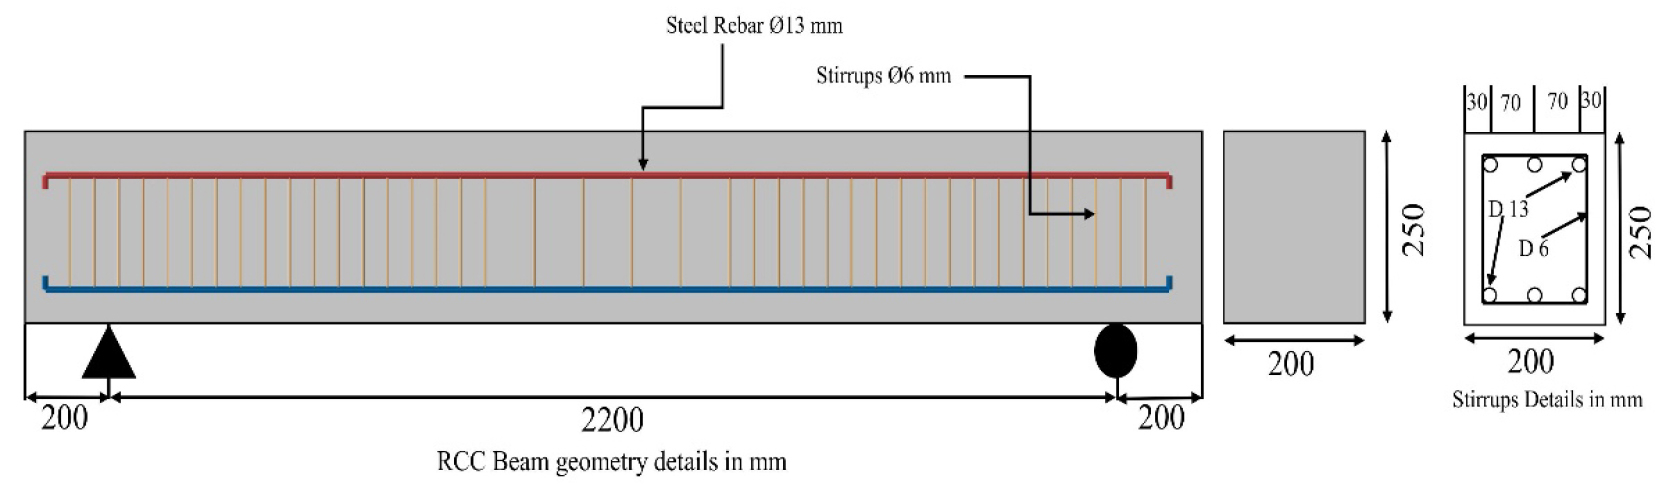
The beam geometry and reinforcement details adopted in the present study are shown in Figure 1. The beam has a length of 2400 mm, width of 200 mm, and overall depth of 250 mm, longitudinal reinforcement consists of 12 mm diameter bars with a length of 2300 mm, while 6 mm diameter stirrups are provided for shear reinforcement. The stirrups cover a width of 153 mm and a depth of 203 mm, with an effective concrete cover of 23.5 mm as illustrated in Figure 1. The stirrups are spaced at 50 mm from both ends up to a distance of 900 mm, while the central 500 mm span has a spacing of 100 mm between stirrups [5].
Material Properties
The concrete used in the model has a characteristic compressive strength of 32.75 MPa, an elastic modulus of 24909 MPa, and a Poisson’s ratio of 0.189, consistent with the values taken from the literature as illustrated in Table 1[3]. Longitudinal reinforcement consisted of 13 mm diameter rebar with an elastic modulus of 182,404 MPa, while shear reinforcement consisted of 6 mm diameter rebar with an elastic modulus of 194,172 MPa, consistent with the values taken from the literature as illustrated in Table 2[3]. The bond between the reinforcement and concrete was modeled using a spring interaction approach [6]. For the sound beam, the initial stiffness Kb is 180 N/mm was calibrating the spring response against the experimental bond slip curve of the sound beam based on a concrete characteristic compressive strength and rebar with a yield strength. This value was used as the peak shear stress in the bond-slip relationship [3].
Table 1.
Concrete material property [3]
| Concrete | Young Modulus | Poisson’s Ratio |
| 32.75 MPa | 24909 MPa | 0.189 |
Table 2.
Steel reinforcement property [3]
| Reinforcement | Young Modulus | Poisson’s Ratio |
| Rebar | 182404 MPa | 0.3 |
| Stirrups | 194172 MPa | 0.3 |
| Main Rebar | Diameter | 13 mm |
| Stirrups | Diameter | 6 mm |
Finite Element Discretization
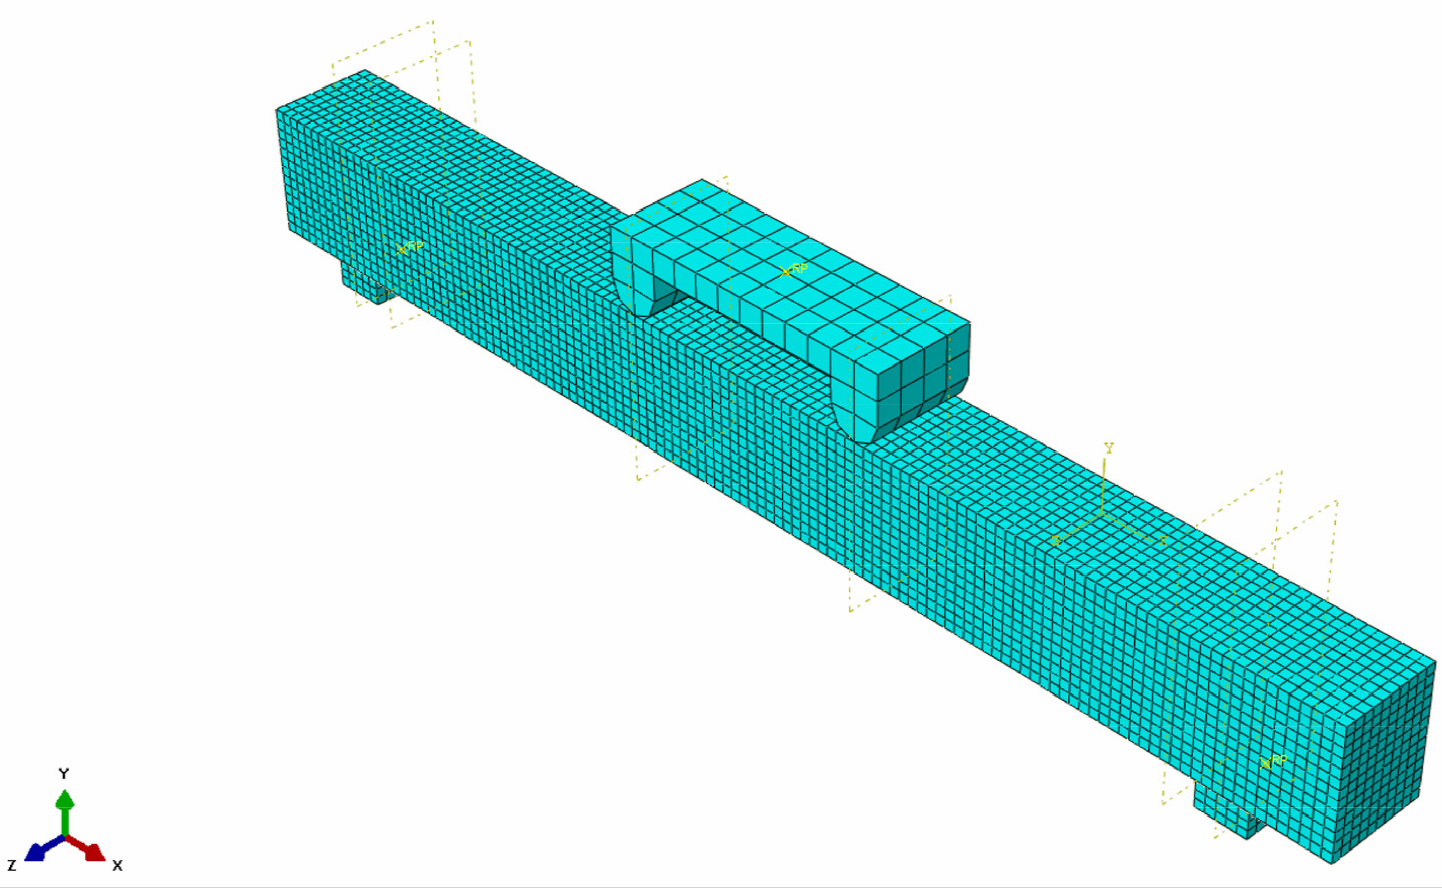
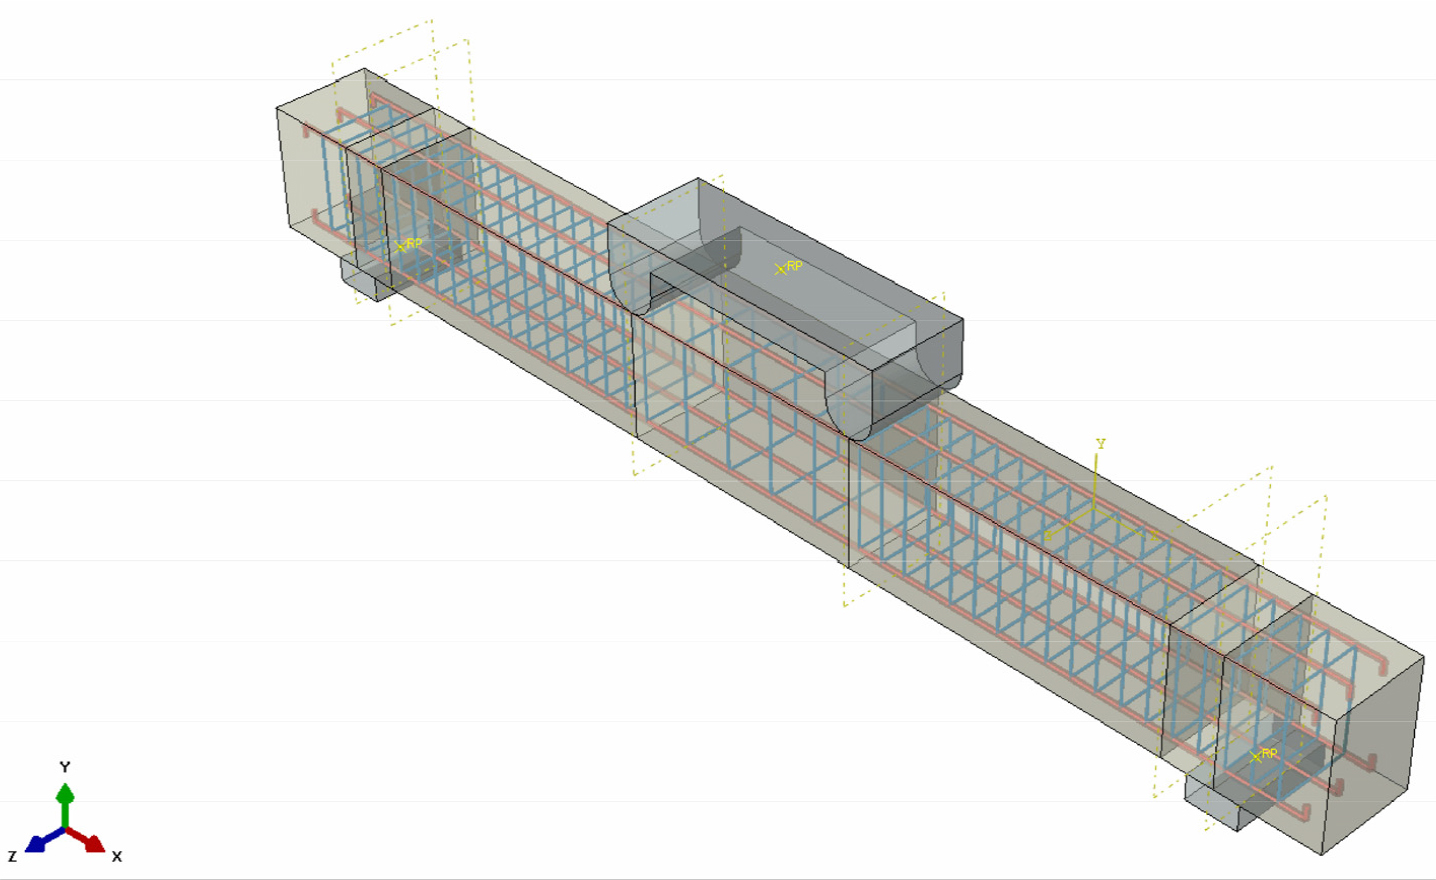
In the model, the selection of appropriate element types is essential. The concrete was modeled using eight-node linear brick elements with reduced integration (C3D8R), whereas the longitudinal reinforcement and stirrups were represented by two-node truss elements (T3D2) as illustrated in Figure 2. A structured meshing scheme was adopted. The element size was assigned as 30 mm for the concrete, 10 mm for both the longitudinal reinforcement and stirrups as, and 30 mm in the support and roller regions [7].
Boundary Condition and Loading
A simply supported beam condition was adopted for the analysis. One end of the beam was modeled as a fixed support, while the other end was restrained using a roller support. To represent the supports, rectangular blocks were placed beneath the beam, and tie constraints were employed to connect the bottom surface of the beam with the top surface of these blocks.
For the loading arrangement, roller elements were positioned on the top surface of the beam at the designated loading locations. Surface to surface tie constraints were applied to ensure appropriate interaction between the rollers and the beam. The supports were placed 200 mm from each end of the beam, while the loading rollers were positioned symmetrically at a distance of 900 mm from each support as illustrated in Figure 3[3].
The analysis was performed using a static loading procedure with displacement control. A vertical displacement of 100 mm in the negative Y-direction was imposed to assess the structural strength of the beam and to capture the initiation and propagation of cracks under loading. The FEM model was first compared against the load-deflection behavior of the sound beam to evaluate its structural performance and ensure agreement with the experimental results from literature [3, 8].
Chloride Diffusion Modeling
In this study, a marine environmental condition characterized by a high chloride concentration in seawater was considered. To simulate the ingress of chloride ions into the concrete, Fick’s second law of diffusion is used in Equation 1. This equation was applied in Abaqus to simulate the chloride ingress under the defined boundary and initial conditions.
Where; C(x , t) = chloride ion concentration at depth x and time t, D = effective diffusion coefficient of chloride ions in concrete (mm2/s), t = time (s), x = depth from the exposed surface (mm),
The diffusion coefficient of 1 × 10⁻⁶ mm2/s was considered for the concrete, as per the literature [9]. This value was specified under the mass diffusion option in the material property definition. The initial chloride concentration within the concrete was assumed to be zero, and the solubility factor was taken as 1.0.
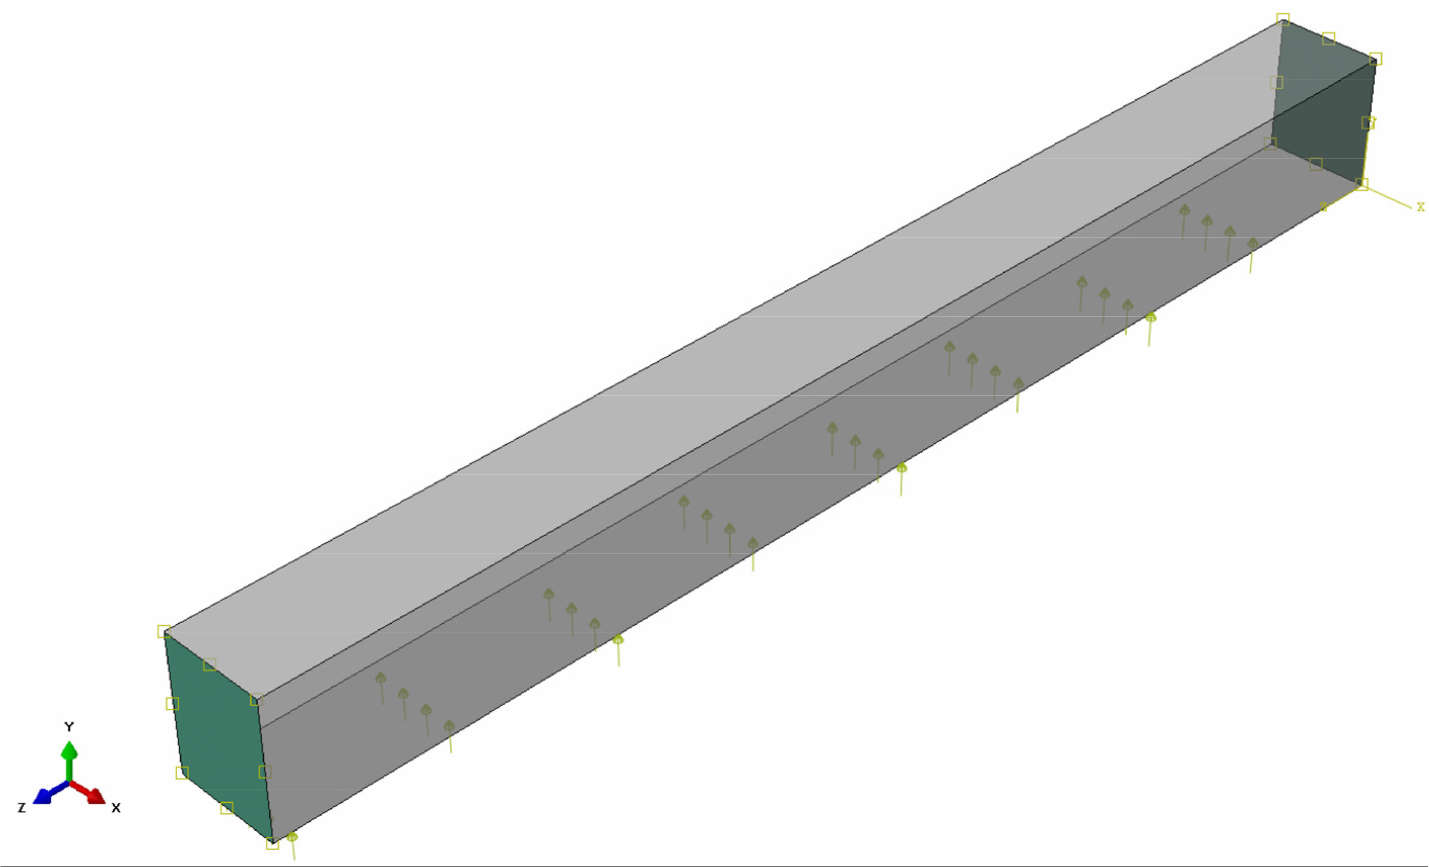
For the boundary conditions, the initial chloride concentration was set to zero along the end surfaces of the beam, as illustrated in Figure 4. To simulate chloride ingress, a surface concentration flux was applied at the bottom surface of the beam, representing the marine exposure zone [9, 10].
The chloride penetration flux was calculated using Fick’s first law of diffusion, using Equation 2:
Where D is the diffusion coefficient (1 × 10⁻⁶ mm2/s) and dC/dx is the concentration gradient. Based on reported values, the surface chloride concentration in seawater was taken as 35,000 ppm, while the initial chloride concentration in concrete was assumed as zero. Considering a concrete cover depth of 23.5 mm, the concentration gradient was obtained as from the formula, the applied surface concentration flux was 1.5×10⁻⁴ ppm/mm2/s. The chloride exposure period was taken as 100 years, which corresponds to approximately 3.1536 × 10⁹ seconds. Time increments were defined on a yearly basis in order to monitor the progressive chloride penetration [9].
Corrosion parameters for FEM
In the present study, the considered corrosion levels of reinforcement bars and the corresponding bond strength between rebar and concrete were simulated in the software. The values were estimated using the experimental formulation which widely adopted for simulation by various researchers [3]. Based on this formulation, calculations were performed for 10% and 20% corrosion levels to determine the reduction in rebar properties and bond behavior. The calculated values were then incorporated into the numerical model. Specifically, the reduction in the elastic modulus of the rebar was quantified as a function of corrosion level, while the deterioration in bond stiffness due to rebar corrosion was also evaluated using the same formulation. Equation 3 and 4, below, present the formula used for rebar corrosion and Equation 5, 6, 7 and 8 for the bond degradation calculation [3].
Where, ΔW: Mass loss (%) due to corrosion; σcy: Yield stress of corroded rebar; Ecs: Modulus of elasticity of corroded rebar; σsy, Ess: Yield stress and modulus of sound rebar [3].
Where; ΔWc: Critical corrosion loss at crack initiation; σt: Concrete strength in MPa [3].
If ΔW<ΔWc: non-corroded rebar
Where, ΔW: Mass loss (%) due to corrosion, τmax: maximum bond shear stress
Where, σb: Concrete compressive strength, Ds: Bond stiffness
If ΔW>ΔWc: corroded rebar
Where, τmax: maximum bond shear stress
Where, Ds: Bond stiffness
Result and Discussion
Load deflection analysis
The load-deflection curve for the un-corroded beam was obtained from the FEM model and compared with the experimental results from literature [3], as shown in Figure 5. Both the FEM and experimental curves exhibit similar behavior throughout the loading process. As seen in Figure 5, up to 10mm of bending the FEM model is showing same behavior as same with experimental behavior the initial linear portion corresponds to the elastic stage of the beam up to the formation of the first crack. After cracking, the beam stiffness gradually decreases, followed by reinforce- ment yielding and a slight load drop before reaching the ultimate capacity.
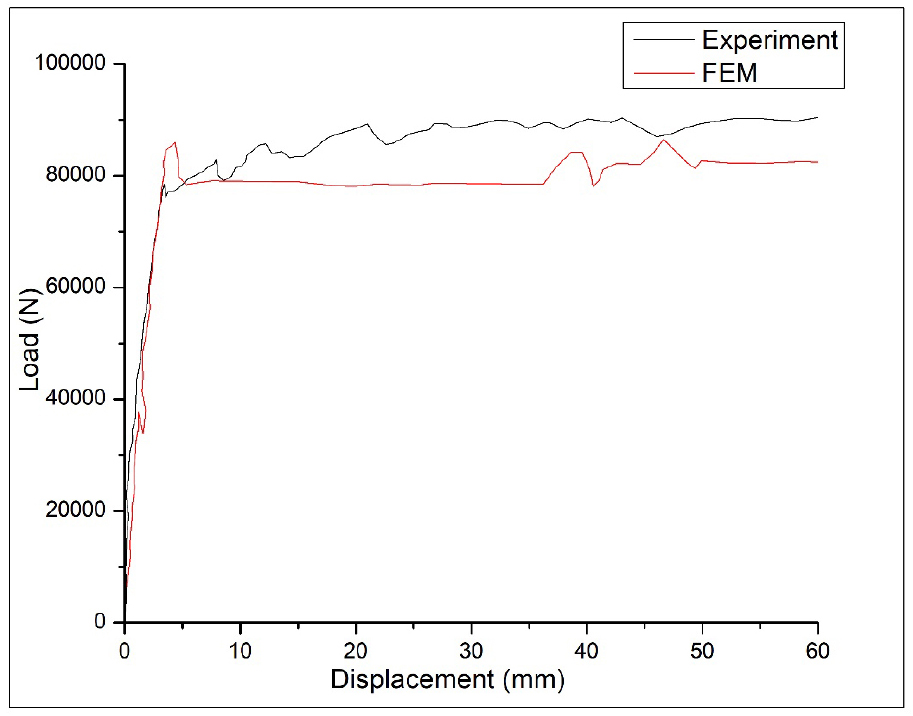
The maximum load obtained from the FEM model was 82 kN up to 7 mm of deflection, which is very close to the experimental peak load of about 85 kN, indicating strong agreement with a deviation, after that deflection is there for FEM model for 35 mm and after that increase in load at 40 to 50 mm it is showing the yield behavior of beam, the FEM curve follows a similar trend to the experimental response, with minor discrepancies attributed to simplified boundary condi- tions and idealized material properties used in the numerical model [3, 11].
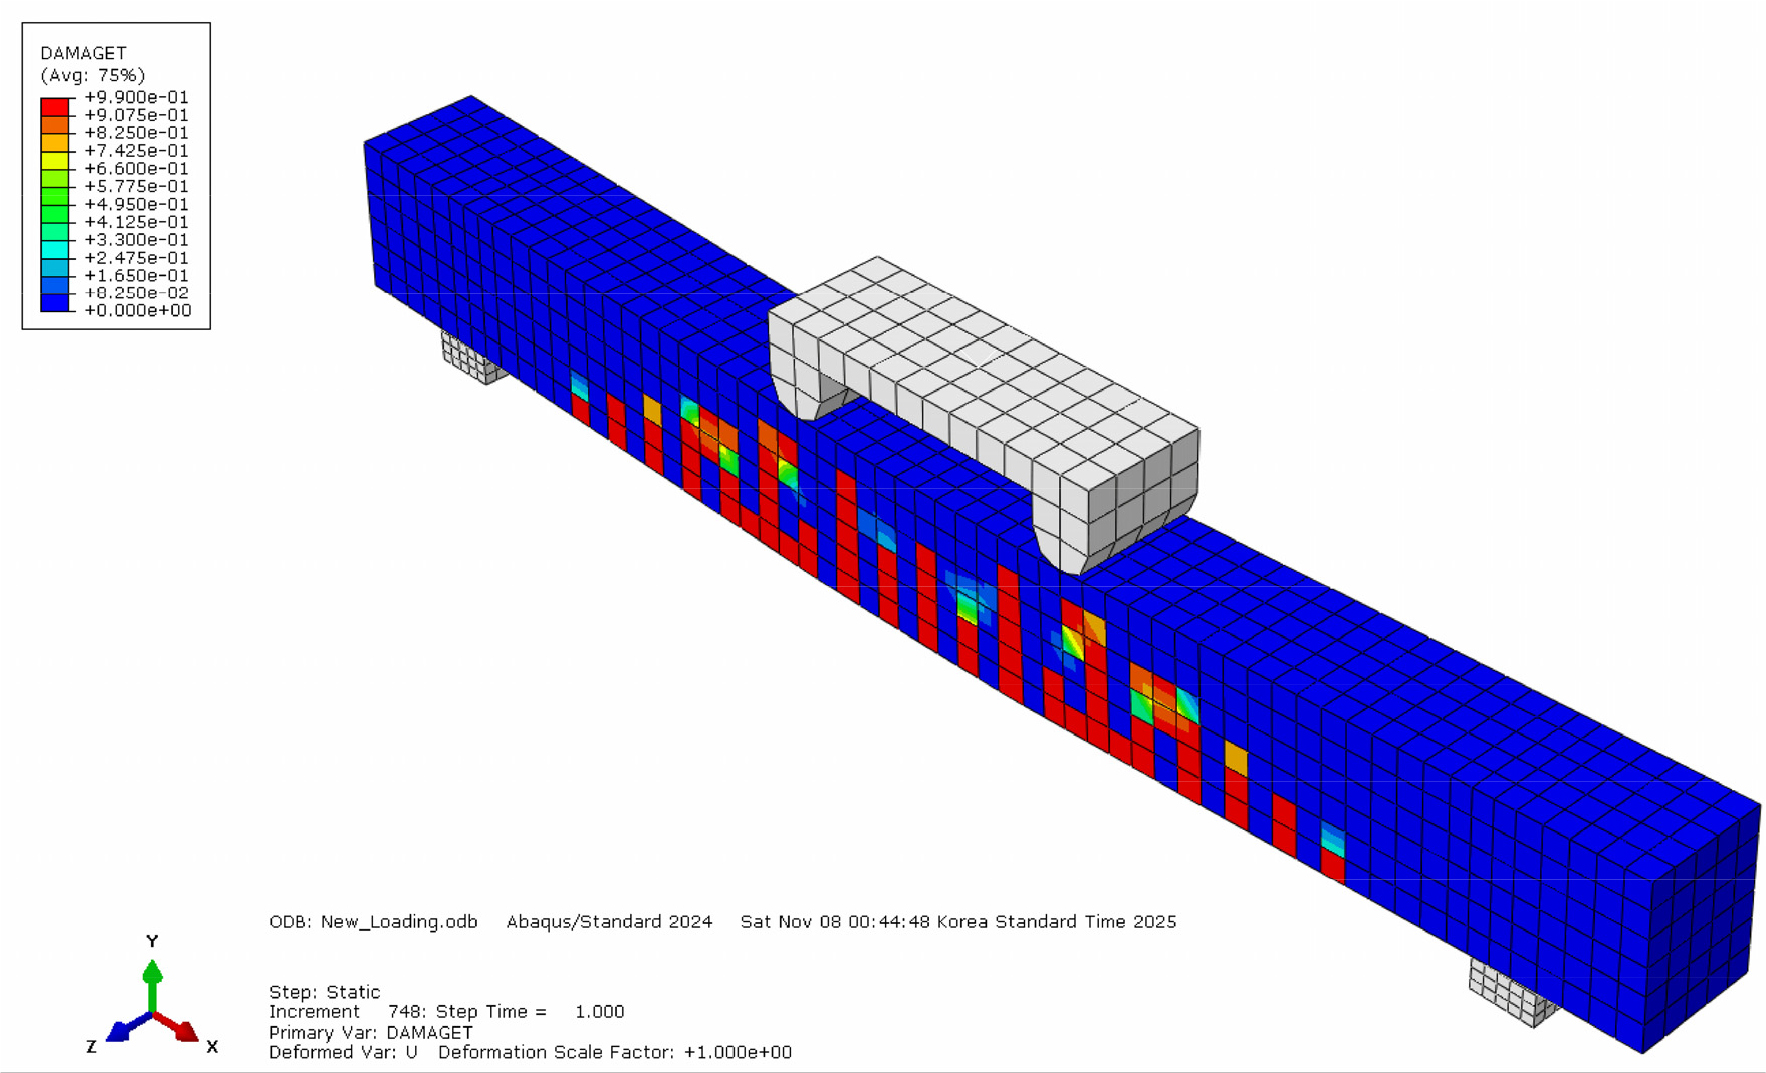
Also we can observe in the Figure 6 damage pattern of the sound beam at the ultimate load stage was extracted from Abaqus. The damage contour clearly indicates the formation of vertical cracks at the mid-span and also in the shear region, the crack behavior observed in the present study in flexure and shear zone is similar to other reports by researchers earlier [3, 7, 11].
Chloride Diffusion Analysis
Figure 7, illustrates the concentration profile evolves over extended exposure periods of 1, 5, and 10 years. Initially, at one year, the chloride content up to 20 mm is 1000 ppm. However, with increasing exposure time, the chloride front advances deeper into the concrete. After five years, a noticeable shift in the concentration curve indicates greater penetration 18000 ppm at the depth of 20mm and 7000 ppm at 30 mm, and by ten years, significant chloride accumulation is observed at much larger depths at 20 mm is 29000 ppm and at 50 mm it is showing 2000 ppm [9, 12, 13].
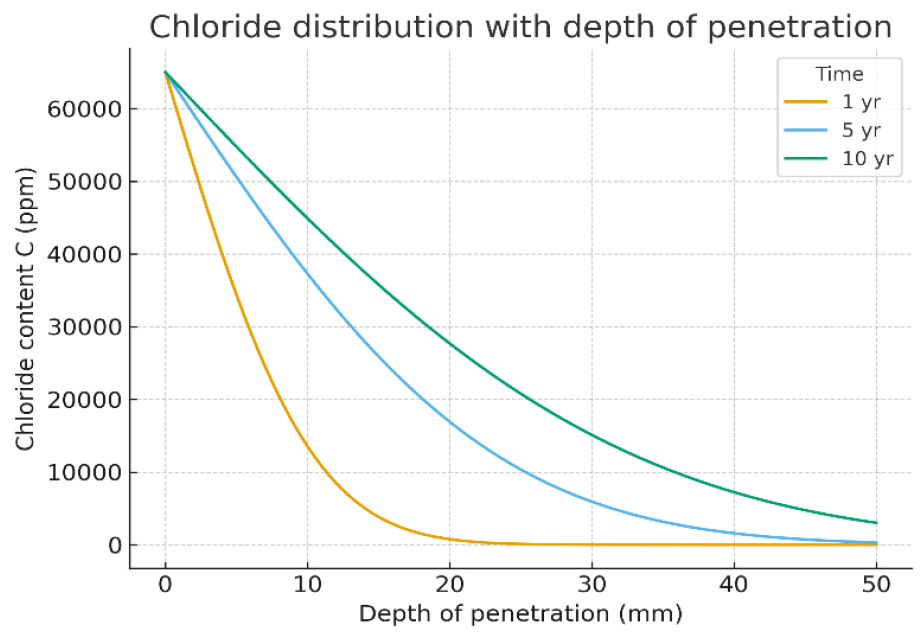
The shift of concentration profiles for any depth reflects the time-dependent characteristic of chloride diffusion. It can be observed that the concentration of chlorides increases with the increase in exposure duration for a given depth, which confirms that the ingress of chlorides is a continuous phenomenon. Such effects are of critical importance to the lifetime performance of reinforced concrete structures, as the gradual increase in chloride concentration at the level of steel reinforcement bars increases the probability of corrosion initiation, cracking, and spalling, thus reducing the in-service lifetime of the structure in question [9].
A sample contour plot of chloride concentration at the 100th year is presented in Figure 8. The chloride flux is assumed to be applied to the tension surface of the beam for 100 years to simulate the realistic marine or deicing exposure condition. The chloride concen- tration is maximum at the bottom of the beam and decreases towards the compression zone showing that diffusion controlled transport of chloride ions through concrete matrix is the dominant mechanism.
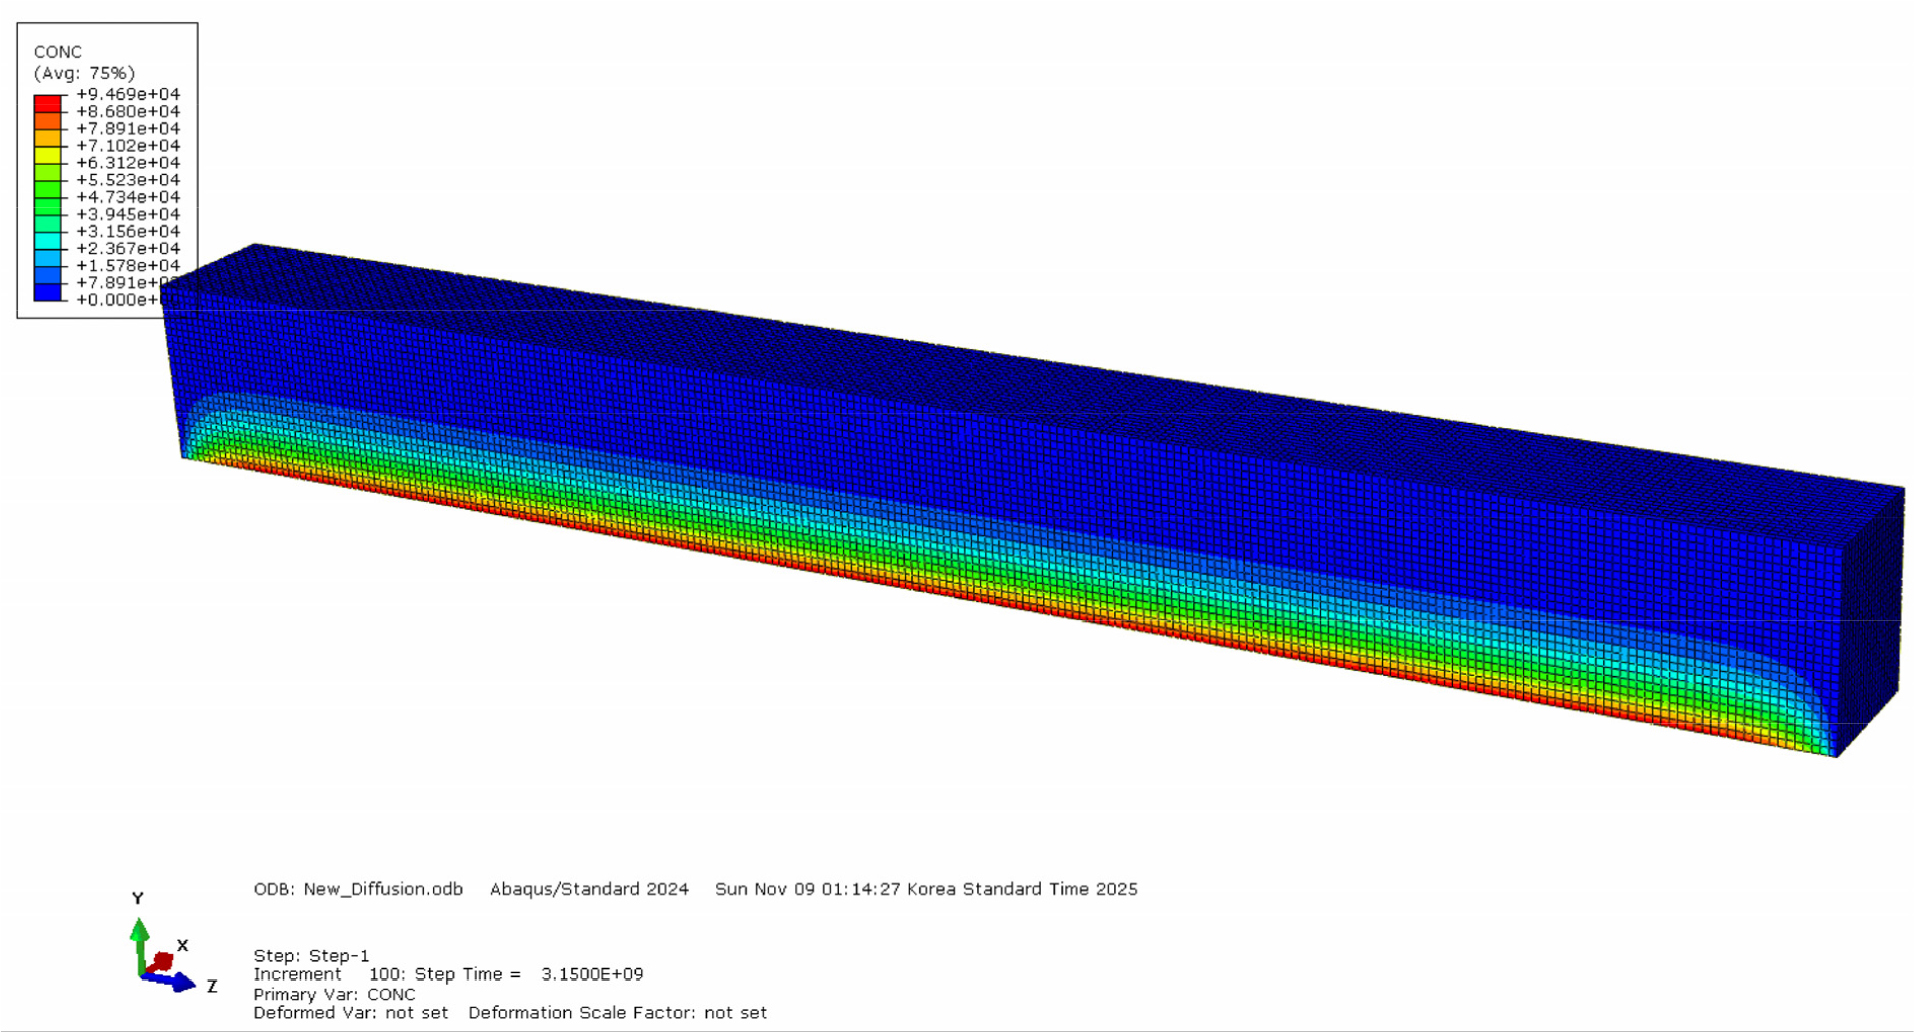
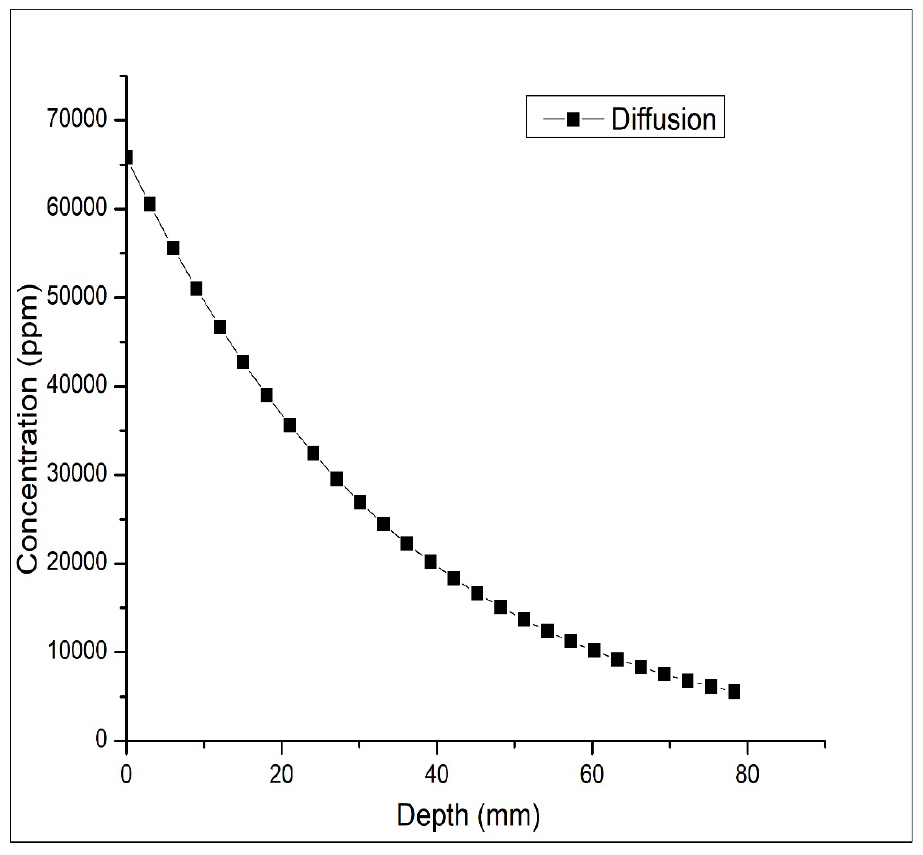
The relationship between the concentration of chloride and the depth and exposure time inside the concrete matrix is quite apparent. The concentration of chloride found at the exposed surface margin shows a maximum as can be seen from Figure 9 and decreases with depth from the surface [4].
Comparison of Corroded Beam
The finite element results for the sound, 10% corroded, and 20% corroded beams are compared in Figure 10. The load-deflection curves clearly illustrate a reduction in both stiffness and ultimate capacity as the level of corrosion increases [14, 15, 16]. The sound beam and corroded beam is following same trend up to the 7 mm with the sustained a peak load of sound beam is 82 kN. In contrast, the beams with 10% and 20% corrosion achieved peak loads of 68 kN and 55 kN, respectively. This represents a reduction in ultimate capacity of around 17% for the 10% corroded beam and 33% for the 20% corroded beam, relative to the sound condition [3].
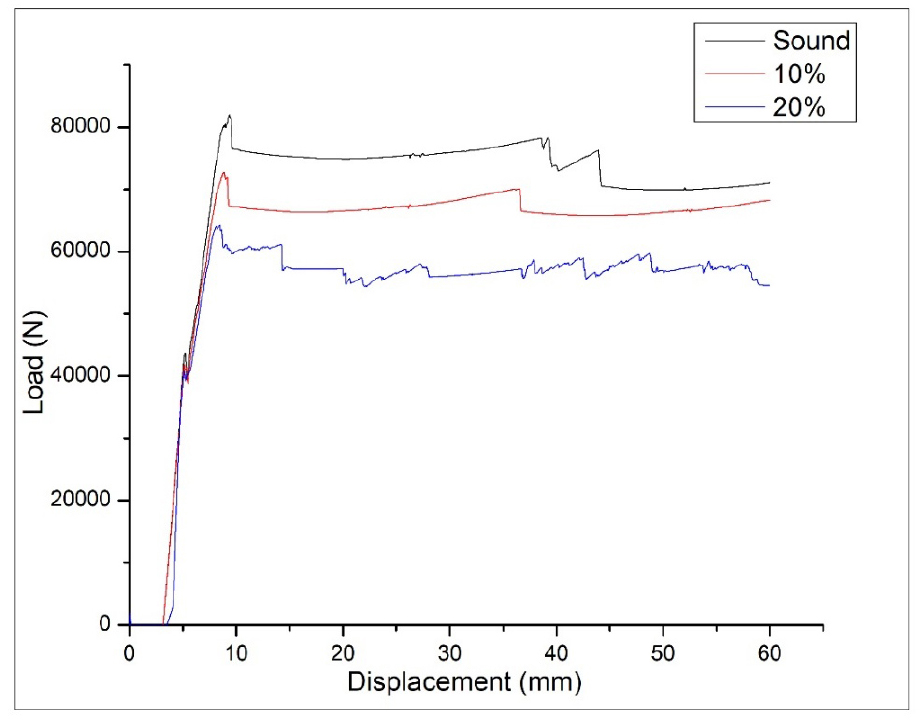
As we can clearly observe in Figure 10, the sound beam and the 10% corroded beam follow the same trend up to 40 mm after the peak load. In contrast, the 20% corroded beam shows a different trend due to the load taken by the corrosion product [4].
In addition to the decrease in ultimate load, the initial slope of the load-deflection curve becomes less steep with increasing corrosion. This flattening indicates a reduction in flexural stiffness, which is attributable to the loss of steel cross-sectional area and deterioration of the steel-concrete bond. Furthermore, the post-peak response of the 20% corroded beam exhibits a more abrupt loss of load-carrying capacity, signifying a transition towards a more brittle failure mode [14, 15].
These findings demonstrate that even minor corrosion can significantly compromise the structural performance of reinforced concrete beams [15, 17].
Bond stress comparison of Corroded Beam
Figure 11, the relationship between bond stress and slip for the sound, 10% corroded, and 20% corroded beams obtained from the FEM simulation. It can be observed that corrosion significantly affects the bond performance between concrete and reinforcing steel. For the sound beam, the bond stress increased almost linearly with slip up to a 5 mm slip it is showing the peak bond stress is 6.9 MPa, indicating good adhesion and confinement between concrete and steel. In case of the 10% corroded beam showed a reduced peak bond stress of 5.0 MPa, while the 20% corroded beam exhibited a much lower peak bond stress value of 2.5 MPa. This progressive reduction in bond stress reflects the degradation of the concrete-steel interface due to corrosion-induced cracking and loss of mechanical interlock [3, 18].
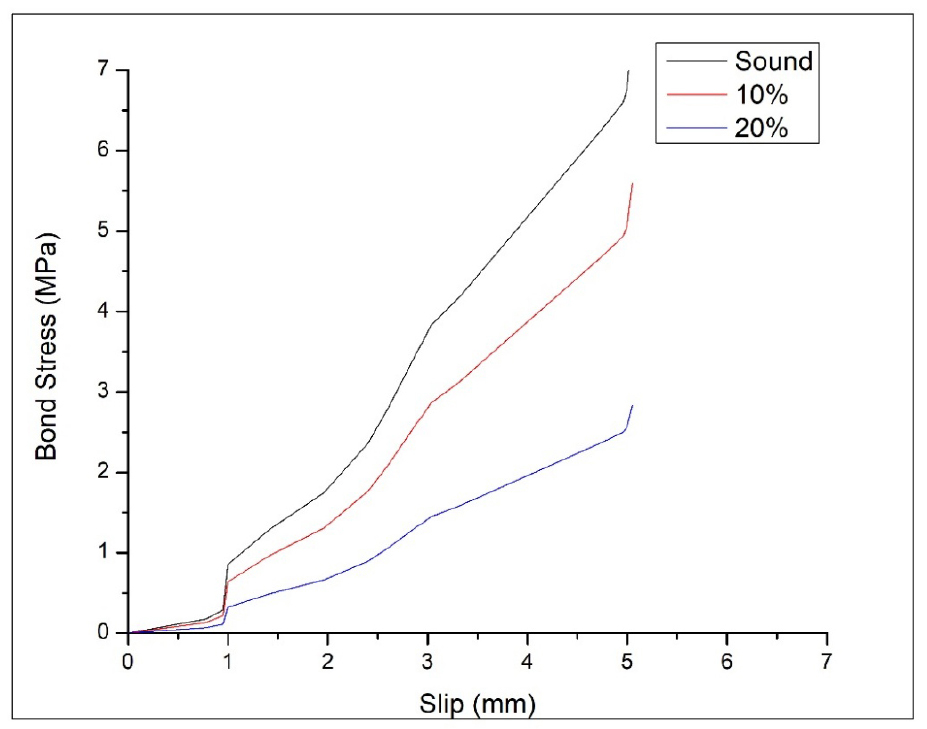
Additionally, the initial portion of the curve for all beams showed a similar slope, representing the elastic adhesion phase. However, as corrosion increased, the transition from elastic to plastic slip occurred earlier, indicating premature de-bonding. Overall, the FEM results demonstrate that corrosion weakens the bond strength and stiffness, leading to a larger slip at lower stress levels [6]. This finding aligns with trends reported in previous experimental studies and confirms the ability of the numerical model to capture the effect of corrosion on bond degradation [18, 19].
Conclusion
To investigate the effect of chloride induced corrosion on reinforced concrete beam a numerical modeling analysis was carried out by applying finite element method (FEM) using ABAQUS. The model was validated against the experimental results of a normal beam. The model shows less than 5% deviation in the load-deflection behavior. By comparing the results, it is concluded that the model is able to predict the structural response under a mechanical load.
The results for the corroded beams showed a meaningful deterioration in terms of the ultimate load, stiffness and bond stress-slip behavior of the concrete-steel interface when the level of corrosion level of 10% and 20% led to reductions of 17% and 33% in ultimate load and 65% in peak load which indicates the effect of corrosion damages on the interface and subsequently the performance of the beam.
The results of the chloride diffusion experiment for 100 years of exposure from tension surface show gradual penetration of chloride ions in concrete and chloride front approaching rebar depth. The contours and profiles of variations show that chloride diffusion in concrete is transport-controlled process and is responsible for corrosion onset in the long run.
Ultimately, the combination of FEM analysis and diffusion model was effective in capturing the mechanical and durability behavior of RC beam degradation. This study may act as a reference for service life evaluation and future studies on corrosion mitigation and durability design of reinforced concrete structures such as bridges. Future work will focus on full coupling between diffusion, corrosion expansion, crack propagation and exploring strengthened configuration using CFRP material or hybrid materials.
