

Introduction
Literatrue Review
Materials and Methods
Study Area
Data and Variables
S-DoT
Results
Hourly Travel Behavior
Hour Period Floating Population
Panel Regression
Discussion
Conclusion
Introduction
The construction of a smart and sustainable city has become an essential issue with increasing awareness in recent years [1]. According to the United Nations, information and communication technologies (ICTs) are implemented in a smart, sustainable city to improve the quality of life, and, efficiency of urban operation and services [2]. The smart city is innovative with a sophisticated mix of technologies, user engagement, and chances to create new opportunities [1]. Information and communication technologies are considered critical elements in smart city applications [2, 3].
As one of the strategies to build a smart city, Seoul, the capital of South Korea, began to install new Internet of Things (IoT) sensors in 2019. The primary purpose of this installation is to collect sophisticated real-time data across the city for predicting, diagnosing, and preventing foreseeable urban problems [4]. The Seoul Metropolitan Government aims to install an additional 1,000 sensors across its administrative boundaries by 2023. The sensor named Smart Seoul Data of Things (S-DoT) collects adjacent real-time floating population and climate factors, including temperature, precipitation, illuminance, humidity, particulate matter, wind, noise, vibration, and ultraviolet rays.
IoT sensors are a leading applied technology in smart city planning [5, 6, 7, 8]. Ultimately, the reason for installing IoT sensors is to effectively provide a variety of solutions to real-life problems [7], as IoT sensors enable us to collect real-time spatiotemporal data at the micro-level. For example, while traditional climate data was provided in a daily average of administrative boundary units, IoT sensors gather more detailed real-time spatial information in a smaller geographic unit [6, 8, 9, 10].
Meanwhile, the unprecedented threat of COVID-19 has caused a tremendous impact on urban living. Nations worldwide implemented social distancing measures such as Stay Home orders, and causing direct effects on people’s physical activity [11]. However, the effects of COVID-19 and distancing measures have different impacts on people’s travel behavior depending on various factors. For instance, the direction of physical activity change varied by location [11], and varying pedestrian activity was identified by the type of urban zones [12]. With the built environment having impacts on people’s travel behavior [13, 14, 15], we could hypothesize that the effects of COVID-19 on people’s travel behavior would differ by location, land use, and the built environment.
To evaluate the performance of the new installation of IoT infrastructure and to identify the COVID-19 effects on people’s travel behavior, the present study analyzed climate and floating population data by S-DoTs. Then, we measured the effects of COVID-19 on the floating population in Seoul. However, due to the massive amount of data, the study focused on S-DoTs deployed in one administrative province in Seoul, Gangnam. Creating fuzziness and unclean features remains a critical task in IoT devices [7]. However, validating S-DoT data and suggesting an analytics framework remains a critical task to improve current smart city planning. The study consisted of five steps. First, S-DoTs and their performance are introduced. Second, hourly travel behavior during the COVID-19 is explained. Third, the hourly floating population is spatially analyzed. Fourth, a panel regression is conducted. Fifth, we conclude by summarizing findings with discussion and suggesting limitations for future research.
Literatrue Review
The smart city is one of the IoT application domains [16]. It is a complex patchwork of synthesis of technologies, user engagement, and chances to open up new opportunities [1]. The IoT refers to ubiquitously connected pieces of equipment under the internet-based protocols that exchange information and communicate [17]. It connects humans to surrounding environments and brings a revolutionary paradigm shift [6].
IoT is diversly applied to smart city services such as healthcare, buildings, transportation, and the environment [7]. IoT devices can be applied to in-home, personal, metropolitan networks and help interconnect them [6]. In cities, IoT sensors are widely being installed to monitor air pollutants. For instance, Microsoft launched Project Eclipse to map out air pollution in Chicago and Miami by installing IoT sensors throughout the cities [18]. The University of Strathclyde collects air pollutants using their own sensors in Glasgow, Scotland [19]. Air Korea and the Seoul Metropolitan Government installed IoT sensors across Seoul in South Korea to monitor dust and other air quality-related compounds [20, 21]. The data collected at IoT sensors are publicized using OpenAPI. Open data gives diverse opportunities for people to use, monitor, analyze and improve their daily routines.
However, IoT sensor data has issues including the creation of unclean-sensor data and resource-consumption costs [7]. It is hardly possible to assume that deployed sensors will operate without malfunctioning. Also, the secure transmission of enormous data is another challenge [8]. Lytras & Visvizi stand critical points that whether every citizen is aware and equipped with skills to use these new devices is unsure [22]. Not everyone has the knowledge to use OpenAPI or manipulate datasets. Arguing installation of IoT sensors without concerns is the argument of “normative bias” [22]. Thus, installing these sensors may result from the ‘functional normative’ process [23]; we install them because that’s deemed a good way of doing it without ethical principles or concerns.
Recently, advances in technology have allowed for real-time spatial floating population data that is open to the public. The term floating population refers to population residing temporarily and people’s movements in a location from one place to another [24, 25, 26, 27, 28, 29, 30]. It is a population that moves through time and space [29, 30]. Generally, a mobile phone-based floating population that identifies an active phone user who sends mobile signals was defined as a spatiotemporal floating population because the captured users move from one given point to another [28]. Lee et al. used these data to measure population volume and assumed that floating population represented transportation demand in a particular time and space [31]. Also, other research tried to examine the public transit accessibility by using floating population and proved that it could identify reliable hourly public transit accessibility patterns [28]. Similar to the mobile phone-based floating population mechanism, IoT sensors installed by Seoul Metropolitan Government can identify adjacent floating populations. However, the performance of IoT sensors remained unexplored, and the fuzziness of the enormous amount of data created by IoT sensors acts as an obstacle.
Meanwhile, COVID-19 resulted in a tremendous impact on travel behavior and shifted mobility patterns. Countries around the world employed different types of social distancing measures, eventually affecting people’s physical activity [11]. Recent studies argue that travel times on average decreased during the pandemic [32] local trips to shopping areas, amusement areas, and borders decreased [33], and the travel patterns of public transportation were more significantly affected by the pandemic than nonpublic transit riders [34]. The use of public transportation usage decreased, while private usage increased [35]. However, Parker et al. argue that lower-income transit riders showed a significantly smaller reduction in the number of trips and travel distance than higher-income [34]. Travel behavior is affected by built environment factors [13, 14, 15], and pedestrian activity also shows different patterns depending on the types of urban zones [12]. Thus, it is likely that different regions in the city share hardly similar travel volumes and patterns during the pandemic.
This study introduces the ongoing application of IoT in Seoul’s S-DoT sensors installed by the Seoul Metropolitan Government since 2019. Due to the lack of empirical research utilizing S-DoT, the study examines floating population data from IoT sensors in Seoul for the first time. Also, we suggest a research framework to use S-DoT data for examining travel behavior and patterns. We assumed that the hourly travel patterns and volume could be represented by IoT sensor-based floating population during the pandemic. The analysis contributes to understanding how IoT sensors work, validating IoT sensor-based data, and understanding travel patterns throughout the pandemic. The study helps better understand the effect of COVID-19 and other urban factors on travel behavior.
Materials and Methods
Study Area
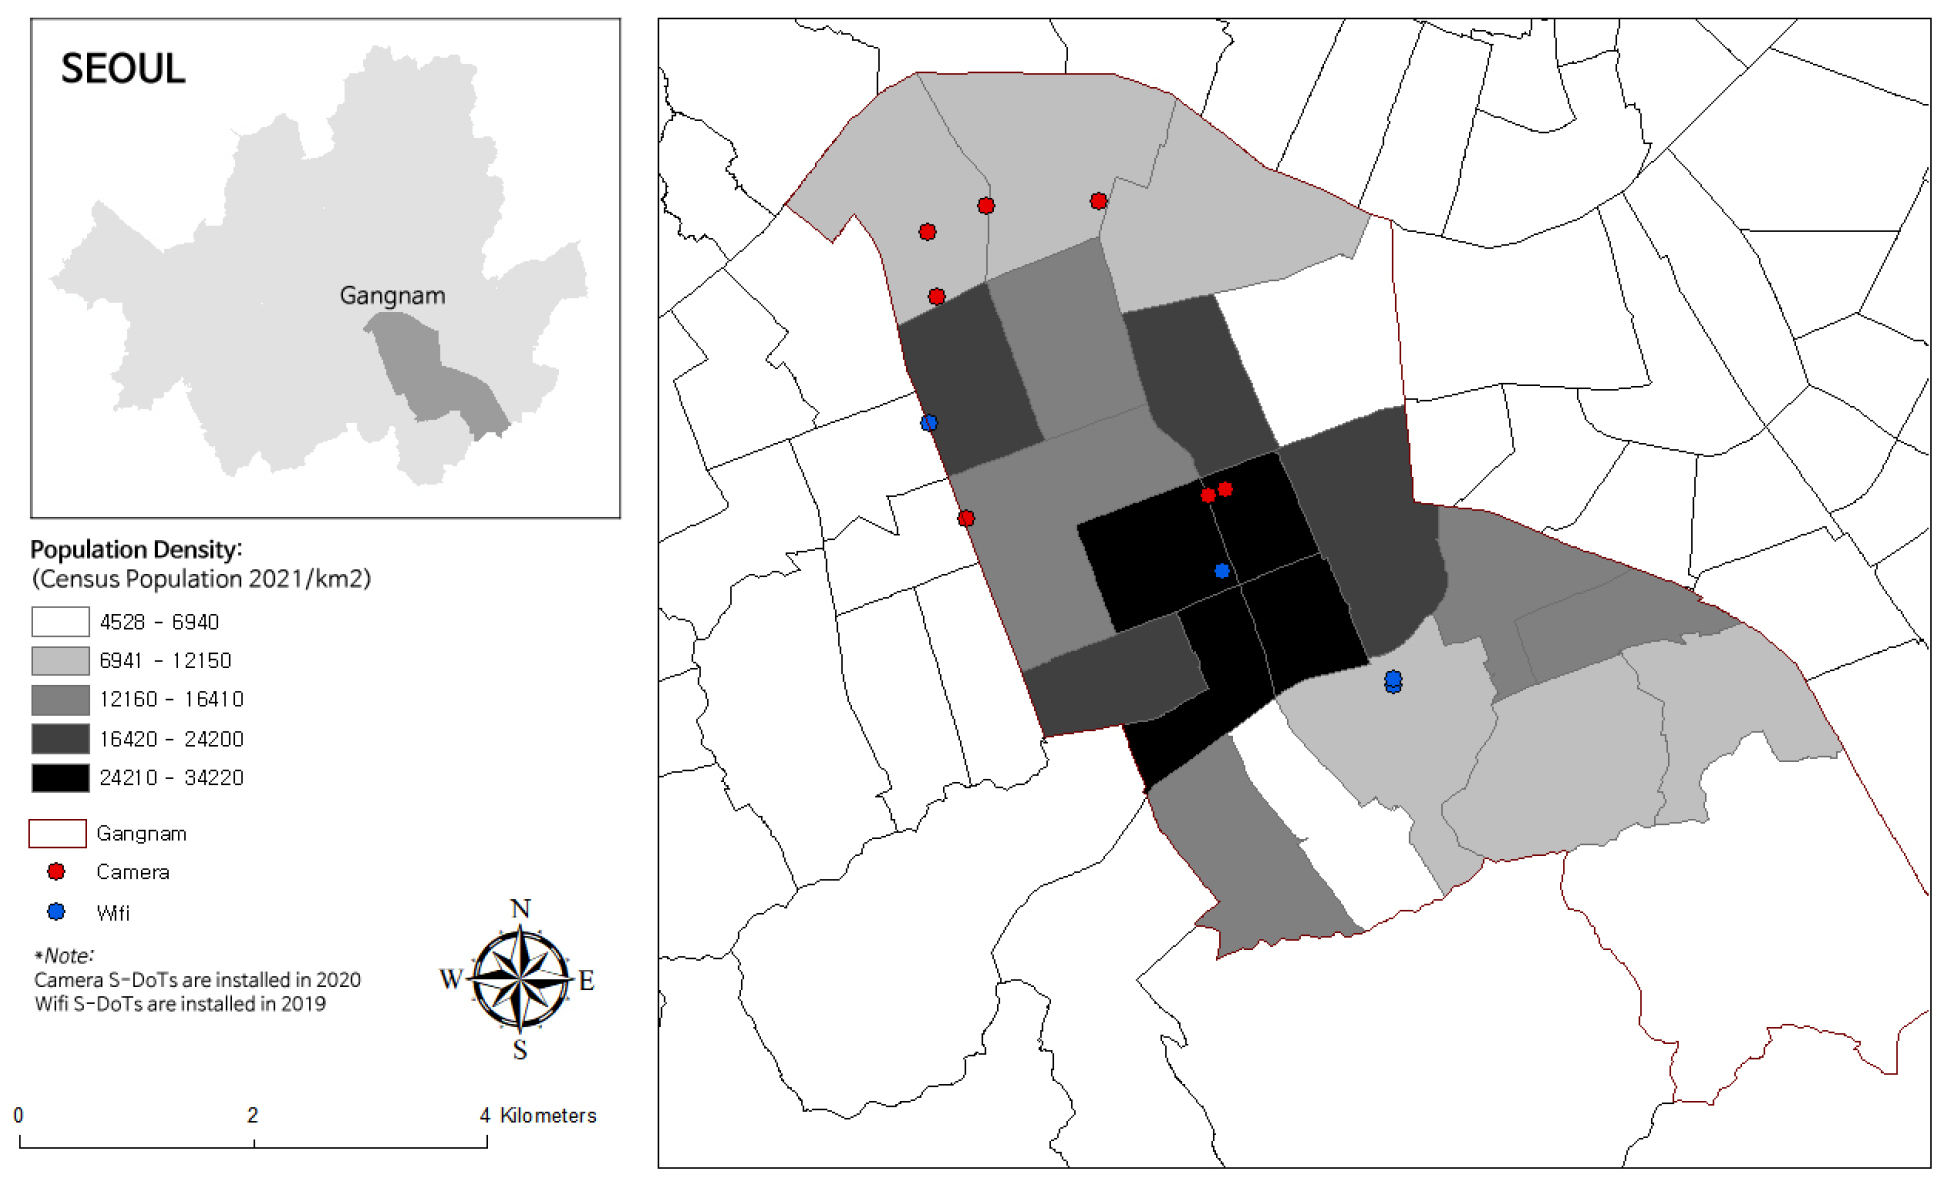
The present study area is Gangnam district (‘gu’ in local terms) in Seoul, South Korea. Seoul is divided into 25 districts, and Gangnam is one of the central business districts in Seoul. There are 22 administrative boundaries (‘dong’ in local terms) in Gangnam. By 2021, Gangnam will have a total registered population of 547,931, representing 6% of the total population in Seoul, and the area is 39km2, which is 6.4% of the total area of Seoul. Seoul Metropolitan Government installed eleven S-DoTs that can collect diverse urban data such as floating population data. Four of them are WiFi detection-based, while the remaining seven sensors are camera-based applications. WiFi detection-based and camera-based S-DoTs were installed in 2019 and 2020, respectively. S-DoTs are located chiefly in the Northern and Central Gangnam areas, as described in Figure 1.
Data and Variables
Seoul Metropolitan Government openly publicizes climate features and floating population data measured by S-DoT on their open data platform. The data is also accessible using OpenAPI. Climate features include temperature, precipitation, illuminance, humidity, particulate matter, wind, noise, vibration, and ultraviolet rays. Climate features are provided every hour on average, and the floating population is offered on the total floating population measured every ten minutes of each deployed S-DoT. However, the Seoul Metropolitan Government requires an application to access the spatial location of deployed S-DoTs. The present study reached out to the Smart Urban Infrastructure team in Seoul Metropolitan Government, and obtained the list of spatial locations with longitude and latitude, deployed year, characteristics, and types of installed S-DoTs.
Five factors of independent variables were collected for the analysis; 1) social, 2) transportation, 3) land use & built environment, 4) climate, and 5) COVID-19 factors. Data curation went through five steps. First, S-DoTs were spatially geocoded based on latitude and longitude information in ArcMap. Second, we clipped the S-DoTs information only within the Gangnam district out of 8 million records for the study period from January 1st, 2021, to May 31st, 2021, using the unique serial code of sensors. Third, the clipped information was grouped for every hour per sensor and was joined with the examined floating population counts provided every ten minutes in Python. Fourth, we created a round buffer of 400 meters from each S-DoT to gather adjacent transportation, climate, land use, and built environment information. The buffer size corresponds to 5 minutes of walking distance, enabling us to collect neighboring information [36]. In detail, a public transit within the buffer was piled up for each sensor to collect the number of transportation users -bus and metro ridership. As most metro stations were outside the buffer, we measured the distance from each S-DoTs to the nearest metro station and collected the usage of the nearest metro station. The near function in ArcMap was used to calculate the distance.
Similarly, for climate factors, we clipped the S-DoTs within 400-meter buffers. The original attempt was to collect hourly climate data for the clipped sensors; however, due to the fuzziness of big data and missing values, it was rearranged to analyze the daily average. For the built environment and land use factor, the land use matrix was intersected with an individual buffer of S-DoTs in the study area and dissolved back by land-use type to calculate the ratio.
Lastly, the variables were tested by using a pairwise correlation test and variance inflation factor (VIF). By taking a log on floating population, daily bus passengers, and daily hourly metro passengers, all of the variables used for the panel regression showed a VIF score of lower than ten and resolved multicollinearity issues. The dependent variable is the floating population, and the explanatory variables are social, transportation, land use, built environment, climate, and COVID-19 factors. For model validation, F-test showed the Fixed Effect (FE) model works more effectively than Pooled OLS. Hausman Test confirmed that the FE model works better than Random Effect (RE) model. LM-test proved that Pooled OLS works better than the RE model. As a result, we chose the FE model for panel regression; however, we also ran Pooled OLS to compare the results.
The unit of analysis is S-DoTs in the Gangnam district and the study period is from January 1st, 2021, to May 31st, 2021. A total of 45,710 S-DoT records were used for the analysis. Variables and descriptive statistics are described in Table 1.
Table 1.
Variables & descriptive statistics
S-DoT
Seoul Metropolitan Government installed 850 S-DoTs in 2019 and plan to install up to 2,500 S-DoTs by 2022. S-DoT can detect ten factors; particulate matter 2.5 and 10, temperature, illuminance, noise, vibration, wind speed, wind direction, and neighboring floating population [37]. For measuring the floating population, sensor serial starting with OC3CL is a camera detection model first implemented in 2020. The serial of WiFi signal-based one starts with V02Q19 was first introduced in 2019. WiFi signal-based S-DoT can detect the WiFi signal within a 50-meter boundary.
In contrast, the camera-based S-DoT can detect floating populations within a buffer created based on its installment height. For instance, if the camera-based S-DoT is installed at a 3-meter height, it can examine the floating population within a radius of 3.4 meters. Seoul Metropolitan Government aims to install S-DoTs equitably across its administrative boundaries. Collected data is provided to the public at Seoul Metropolitan Government’s open-source data platform.
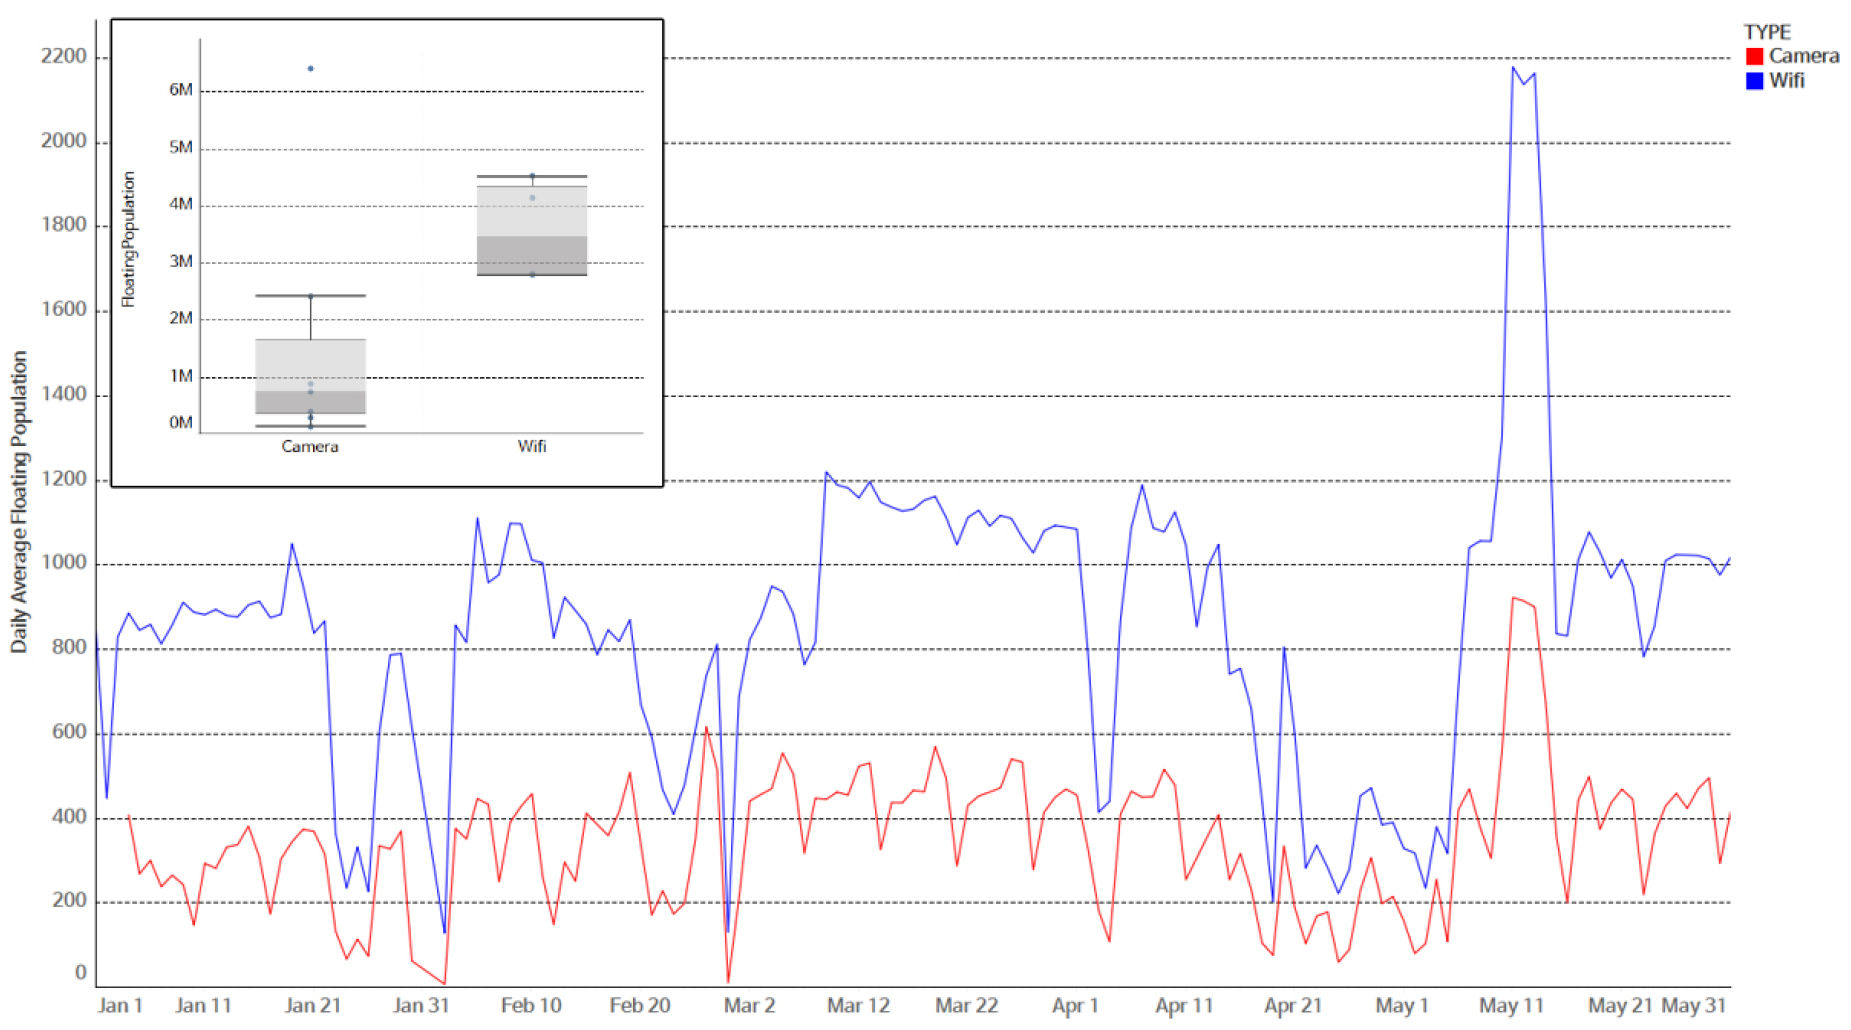
Eleven S-DoTs have been installed in Gangnam. Seven of them are camera detection based, and four of them are WiFi signal based IoT sensors. Although there are a more significant number of camera detection S-DoTs, WiFi signal-based S-DoTs outperformed as described in Figure 2. The WiFi signal-based S-DoTs in Gangnam always have more significant captured total daily average floating population during the study period. Hence, the WiFi signal-based S-DoTs have a higher median total floating populating than the camera detection model described in the box plot.
Results
Hourly Travel Behavior
Eleven S-DoTs in Gangnam district present a more significant median hourly average floating population during the afternoon than the morning and night hours. Specifically, the median average floating population incrementally increases from 7 AM and peaks at 4 PM. Then, the median average floating population gradually decreases. As described in Figure 3, except for the one outlier, OC3CL20022, WiFi signal-based S-DoT (serial starting with V02Q19) has a higher hourly average floating population than camera one’s (serial starting with OC3CL).
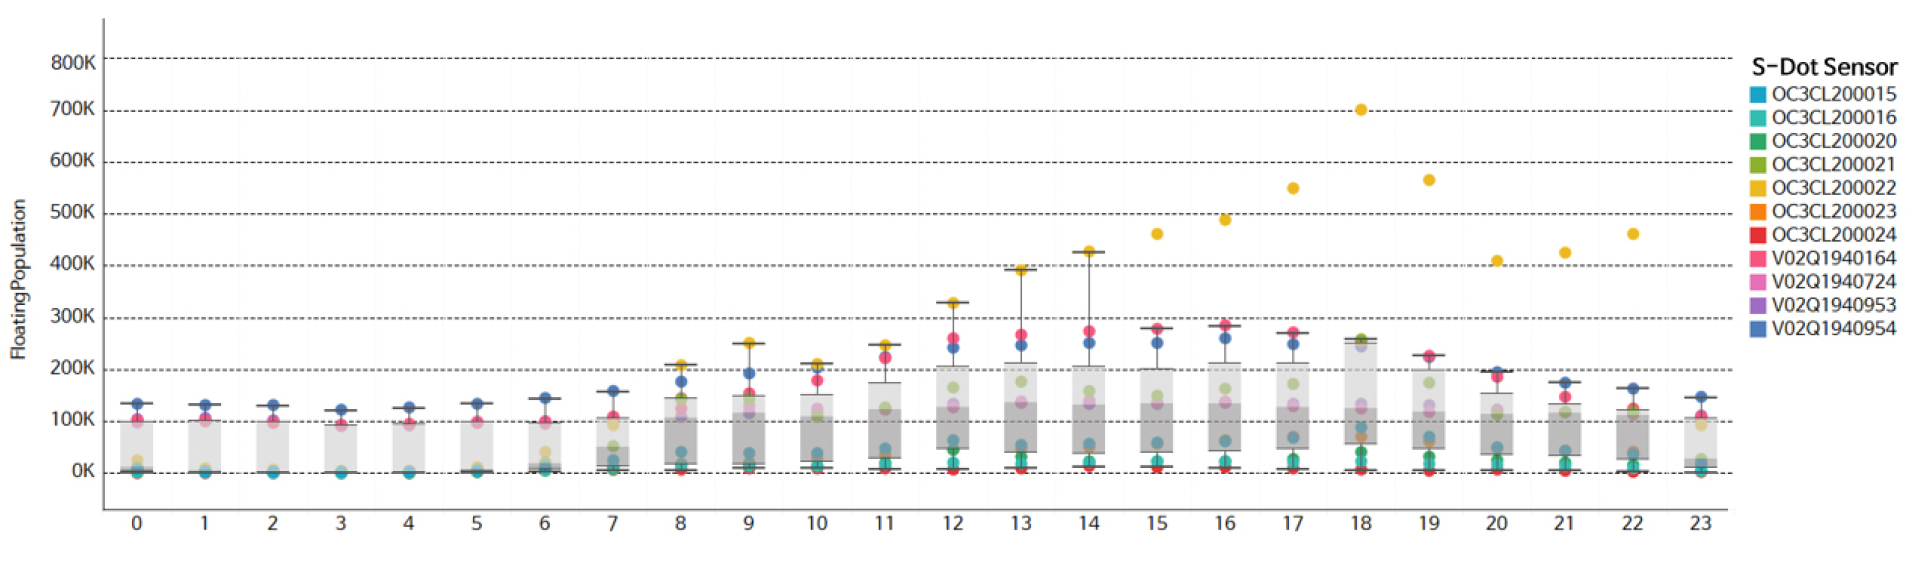
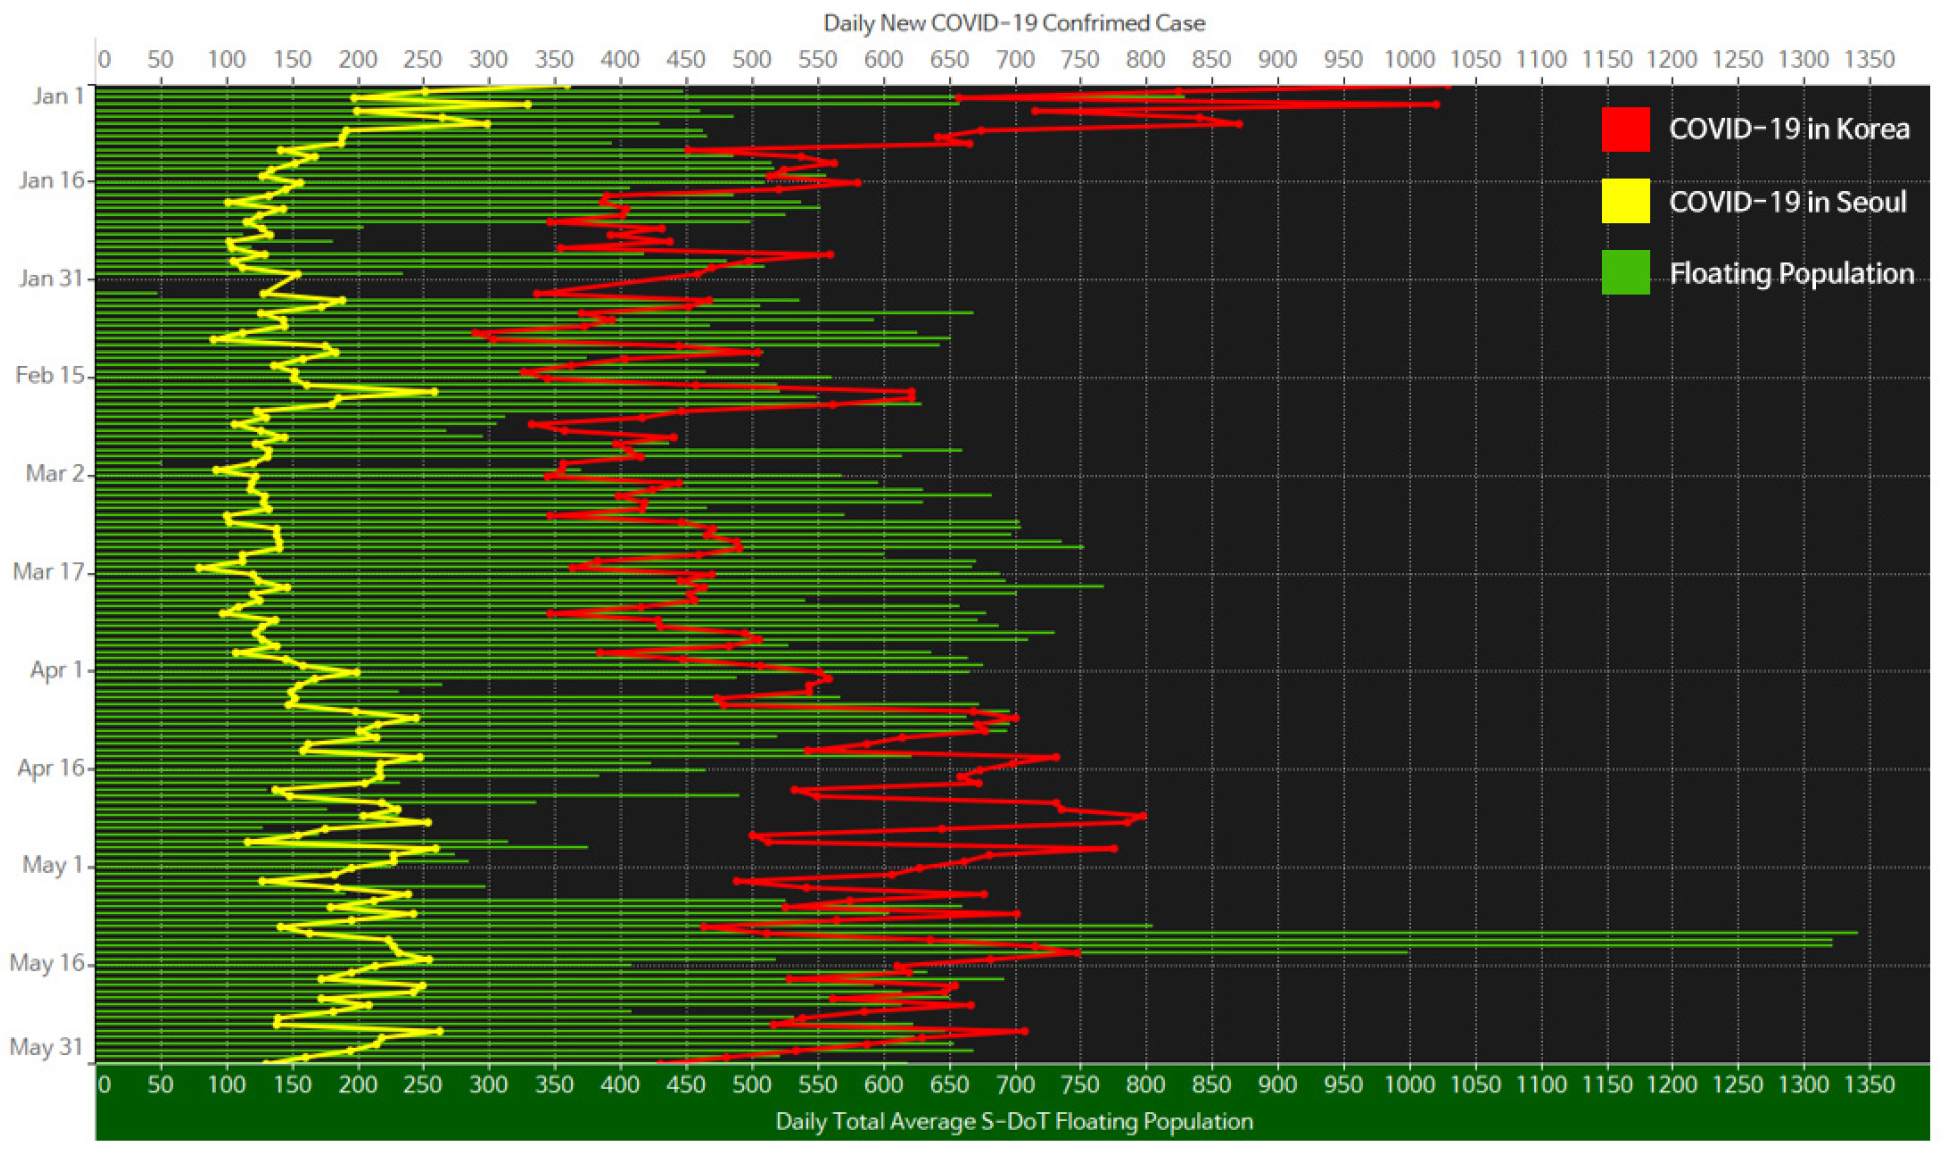
Figure 4 compares the daily average S-DoT floating population in Gangnam to the daily new confirmed COVID-19 cases in South Korea and Seoul. About 20-40% of daily new confirmed COVID-19 cases in South Korea were reported in Seoul throughout the study period. On a daily average, 542 floating population in Gangnam was examined throughout the pandemic. The daily average of reported confirmed COVID-19 cases are 165, 520 for Seoul and South Korea. When newly confirmed COVID-19 cases in Korea stabilized throughout March and April, the daily total average floating population remained its average pattern. However, as newly confirmed COVID-19 cases in Korea increased between mid-April and May, the daily total average floating population plummeted and hit its peak in mid-May.
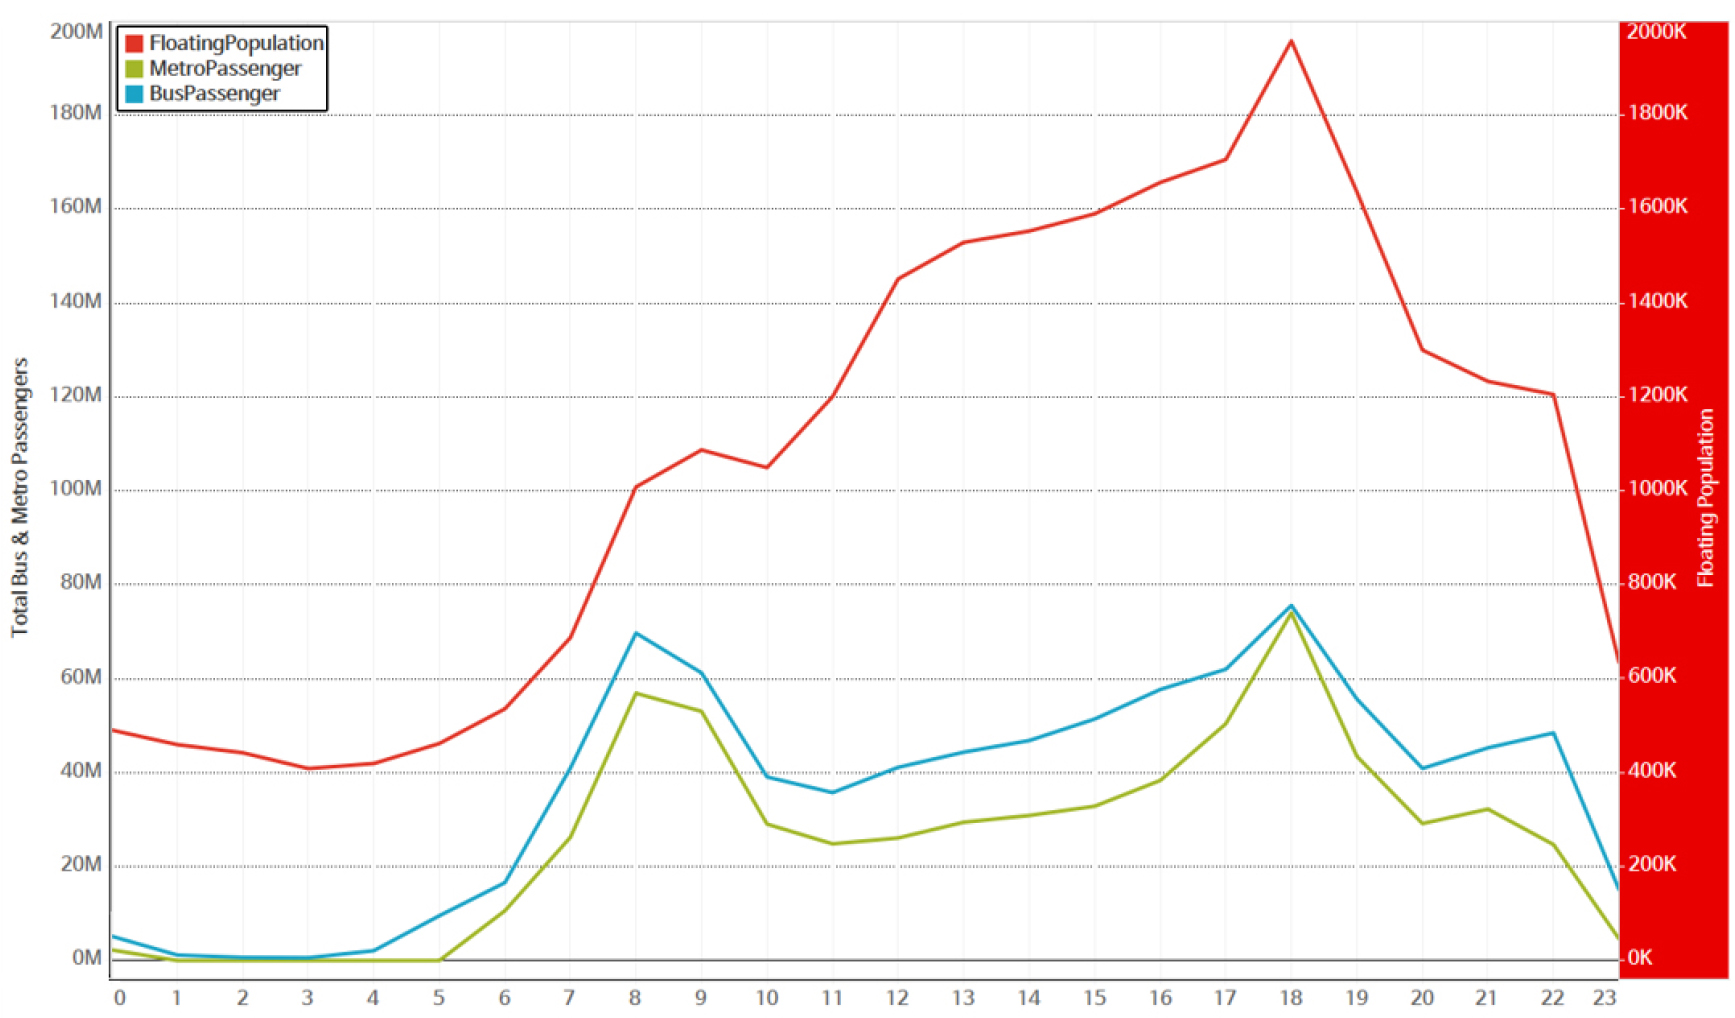
Total hourly accumulated floating population, bus, and metro users showed a similar pattern by hitting its peak at 6 PM. However, the floating population incrementally increased from 4 AM and gradually increased until 6 PM compared to transit users. Bus and metro usage hit their first peak at 8 AM, decreased, then hit the second peak at 6 PM, displaying the higher number of transit users during rush hours. It seems a portion of the floating population that visited and commuted to Gangnam during the morning rush hours (7 to 9) stayed until lunch and afternoon hours. Then, they left after the night rush hours (17 to 19), as described in Figure 5. Because Gangnam is one of the central business districts in Seoul with mega retail shops, firms, recreational amenities, and education centers, people seem to spend their time in the district mostly from morning to evening rush hours. Workers, visitors, and students would visit Gangnam to spend their daily lives from their living places.
Hour Period Floating Population
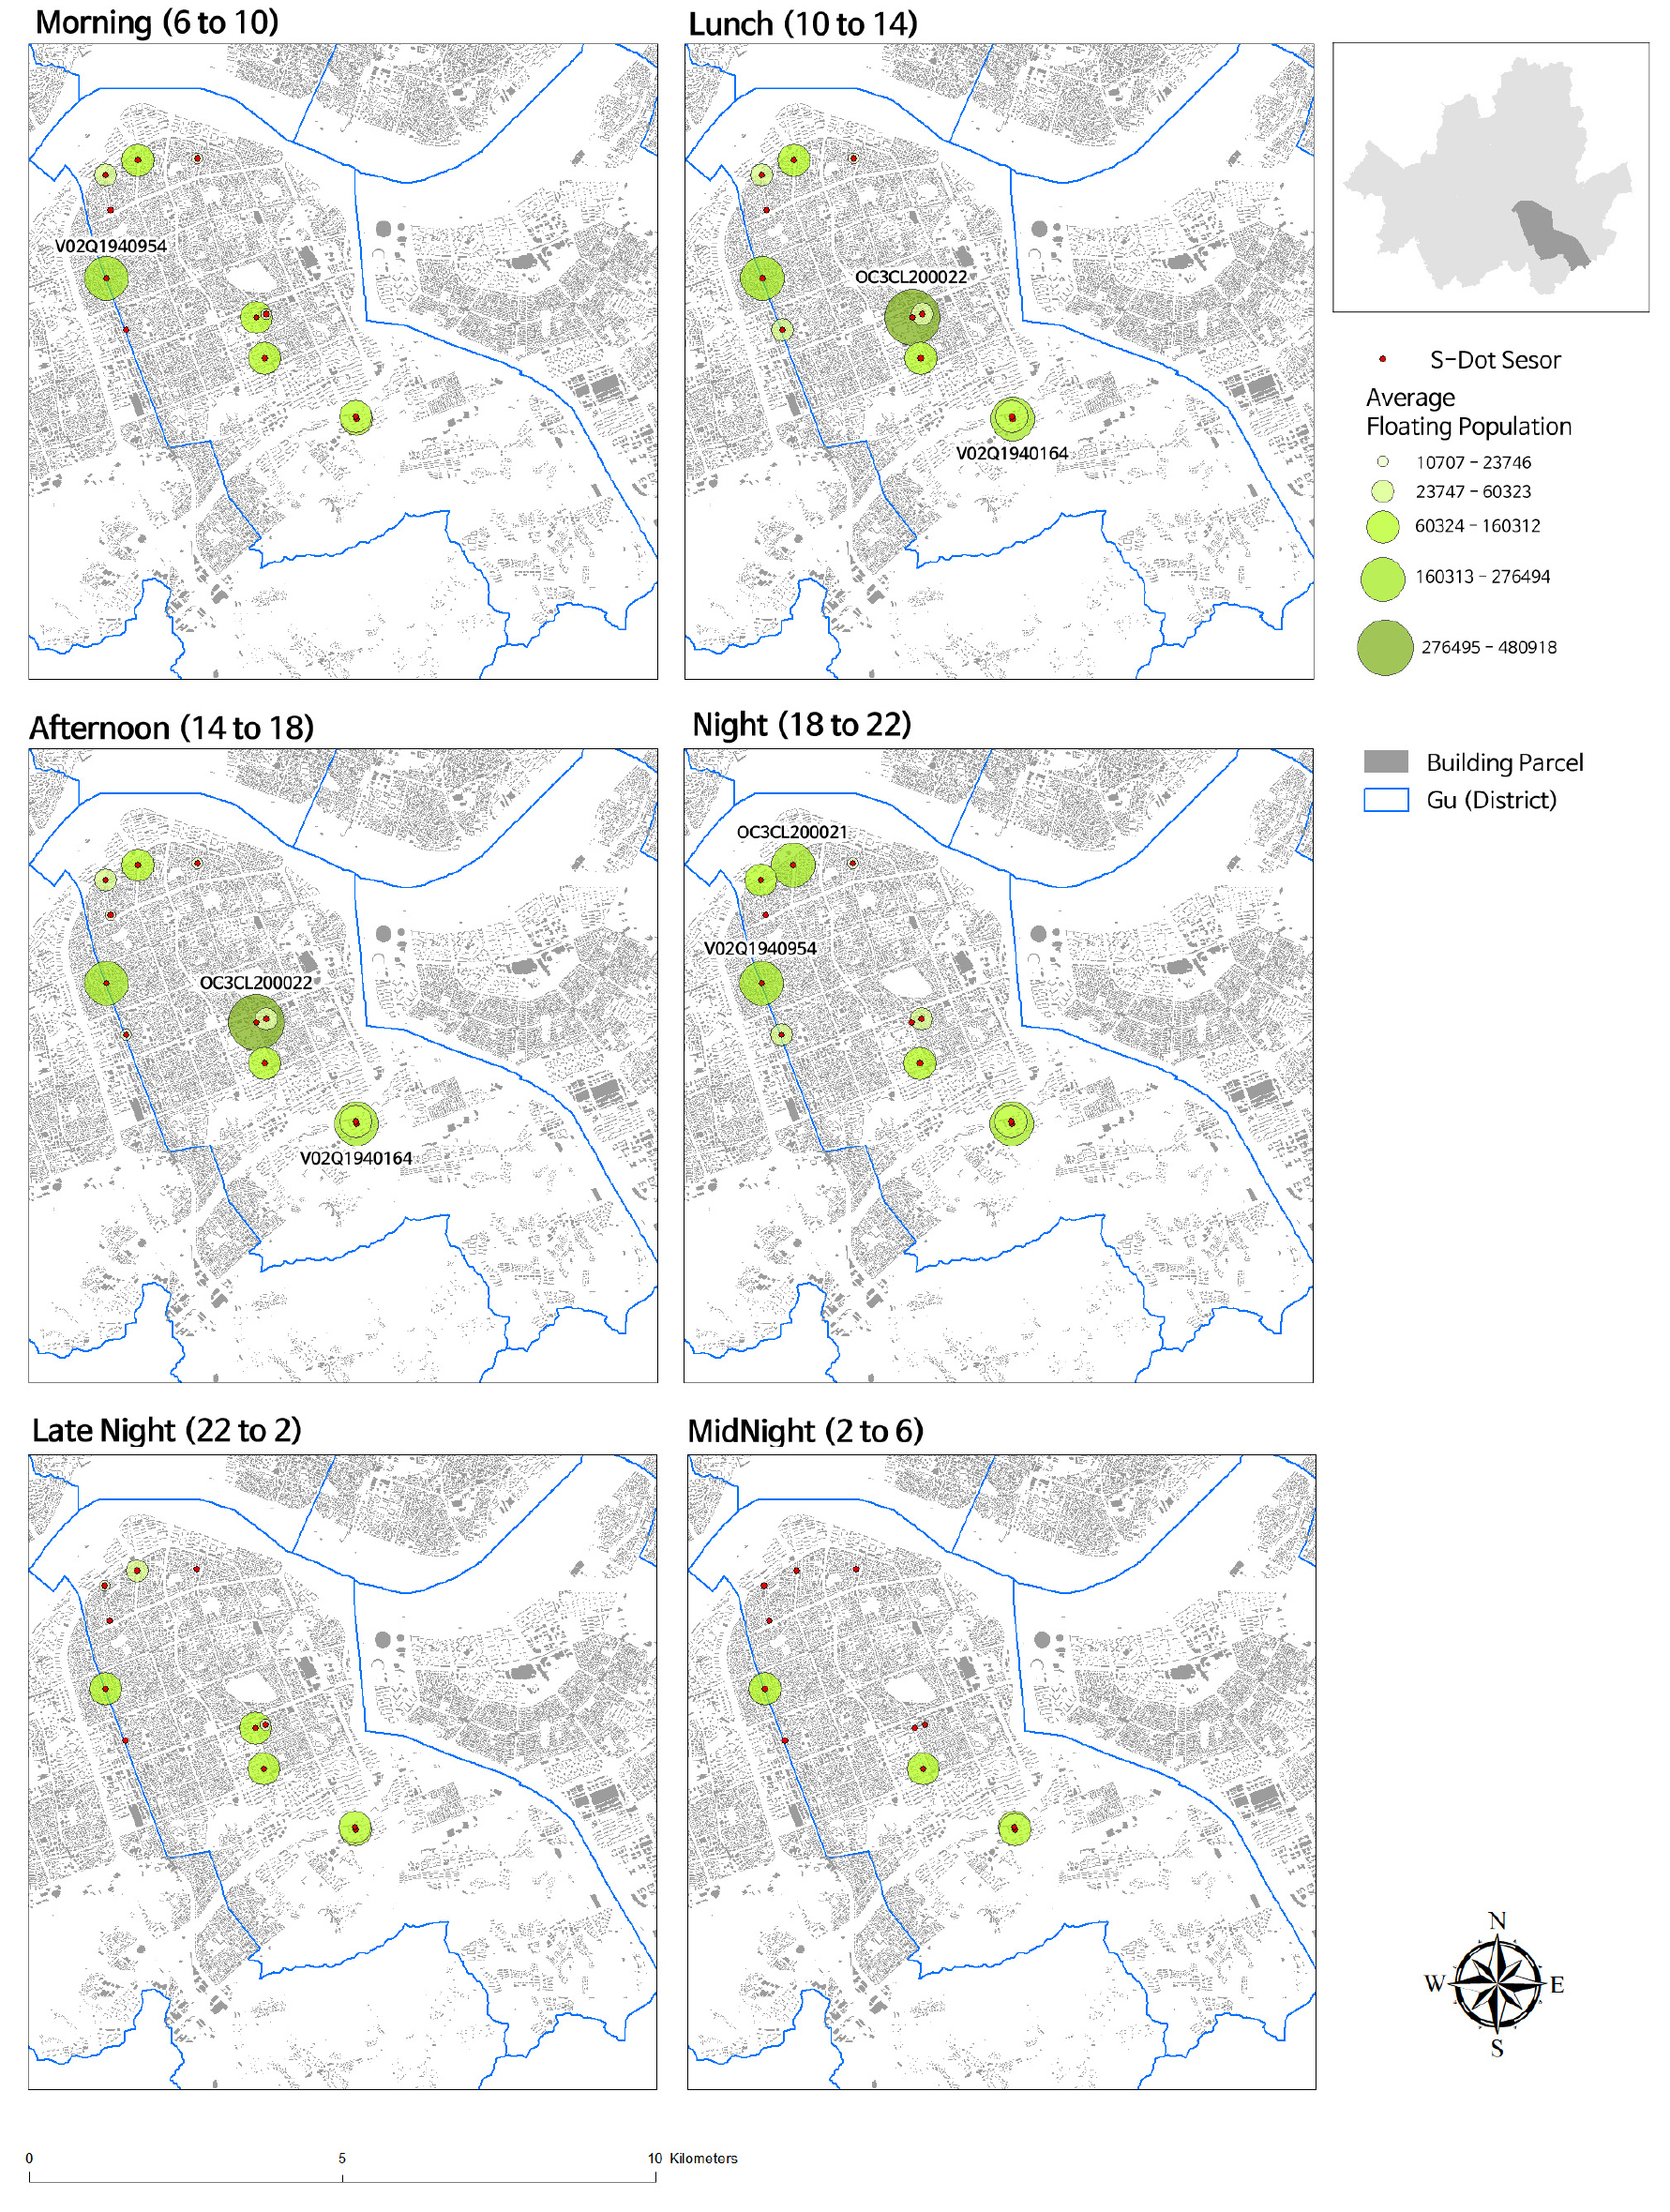
The average floating population of hour periods presented different patterns by sensors. We defined morning, lunch, afternoon, night, late-night, and mid-night hour periods by considering people’s daily activities. Each hour period consists of four-hour intervals; morning (6 to 10), lunch (10 to 14), afternoon (14 to 18), night (18 to 22), late-night (22 to 2), and midnight (2 to 6). It is spatially analyzed as described in Figure 6. A higher average floating population was shown at the S-DoTs (V02Q1940954 and OCL3L20021) at the edges in the Gangnam district in morning and night hour periods. However, in lunch and morning hours, a more significant average floating population was identified from S-DoTs (OCL3CL200022 and V02Q1940164) in the central district. This result confirms that the degree of floating population differs spatially throughout the hours.
Panel Regression
Table 2 describes the panel regression result. Model 1 shows a statistically significant relationship of floating population to bus and metro users (p < 0.001), ultraviolet ray (p < 0.001), particulate matter 2.5 & 10 (p < 0.001), illuminance (p < 0.05), and new COVID-19 reported cases in Korea and Seoul (p < 0.001). Similarly, Model 2 shows a statistical significance in all factors, except temperature and precipitation. These two variables were not statistically significant in Model 1. In both models, COVID-19 variables showed similar coefficient values. A newly reported COVID-19 reported case in Korea has a negative effect on the floating population.
Table 2.
Panel Regression Result
| Model | DV | ln(Floating Population) | |||||
|
Model 1 (FE) | IV | Variables | Coef. | S.D. | t | P | |
| Transportation | ln(Bus Passengers) | -1.049 | 0.462 | -22.68 | 0.000*** | ||
| ln(Metro Passengers) | 1.226 | 0.019 | 62.06 | 0.000*** | |||
| Climate | Temperature | -0.006 | 0.003 | -0.27 | 0.786 | ||
| Precipitation | 0.016 | 0.020 | 1.23 | 0.220 | |||
| Ultraviolet Ray | -0.005 | 0.002 | -3.63 | 0.000*** | |||
| Illuminance | -0.000 | 0.000 | -2.32 | 0.021* | |||
| Humidity | -0.000 | 0.001 | -0.41 | 0.685 | |||
| PM 2.5 | 0.003 | 0.000 | 11.81 | 0.000*** | |||
| PM 10 | 0.006 | 0.001 | 5.05 | 0.000*** | |||
| COVID-19 | New COVID-19 Case in Korea | -0.001 | 0.003 | -8.21 | 0.000*** | ||
| New COVID-19 Case in Seoul | 0.003 | 0.000 | 6.15 | 0.000*** | |||
| Intercept | 2.370 | 0.327 | 7.24 | 0.000*** | |||
|
Model 2 (Pooled OLS) | IV | Variables | Coef. | S.D. | t | p | |
| Social | Population Density | 0.000 | 3.87E-06 | 14.59 | 0.000*** | ||
| Transportation | ln(Bus Passengers) | 0.540 | 0.324 | 16.64 | 0.000*** | ||
| ln(Metro Passengers) | 0.853 | 0.261 | 32.61 | 0.000*** | |||
| Number of Bus Station | 0.124 | 0.007 | 15.82 | 0.000*** | |||
| Number of Metro Station | -2.226 | 0.103 | -21.52 | 0.000*** | |||
| Number of Bike Station | -1.946 | 0.058 | -33.01 | 0.000*** | |||
| Built Environment | Number of CCTV | -0.035 | 0.002 | -15.83 | 0.000*** | ||
| Residential | 9.611039 | 0.741 | 12.95 | 0.000*** | |||
| Cultural, Leisure, and Sports | -80.47639 | 2.981 | -26.99 | 0.000*** | |||
| Open Space | -10.775 | 1.182 | -9.11 | 0.000*** | |||
| Climate | Temperature | -0.002 | 0.003 | -0.61 | 0.540 | ||
| Precipitation | -0.023 | 0.020 | -1.19 | 0.233 | |||
| Ultraviolet Ray | 0.114 | 0.002 | 5.66 | 0.000*** | |||
| Illuminance | -0.000 | 0.000 | -3.78 | 0.000*** | |||
| Humidity | 0.010 | 0.001 | 6.35 | 0.000*** | |||
| PM 2.5 | 0.003 | 0.000 | 8.48 | 0.000*** | |||
| PM 10 | -0.004 | 0.001 | -2.65 | 0.008** | |||
| COVID-19 | New COVID-19 Case in Korea | -0.001 | 0.003 | -5.77 | 0.000*** | ||
| New COVID-19 Case in Seoul | 0.004 | 0.000 | 5.6 | 0.000*** | |||
| Intercept | -1.308 | 0.396 | -3.3 | 0.001** | |||
Nevertheless, a newly reported COVID-19 case only in Seoul showed a positive effect on the floating population, controlling other variables constant. Specifically, Model 1 shows that a one-unit increase of COVID-19 cases in Korea results in a 0.1% decrease in the floating population. A one-unit increase of COVID-19 cases in Seoul results in a 0.3% increase in the floating population. Model 2 discerns that one unit increase of COVID-19 cases in Korea results in a 0.1% decrease in floating population; however, one unit increase of COVID-19 cases in Seoul results in a 0.4% increase in floating population.
Discussion
IoT installments in cities have been implemented as a part of ongoing sustainable smart city planning. Among them, IoT sensors are the pivotal component to solving urban issues. Generally, they are installed to map out climate pollutants or to examine floating populations. Starting from 2019, Seoul installed its IoT sensors, S-DoTs. As S-DoT’s performance and validation remains unexplored, the study is meant to fill the gap by examining travel behavior during the COVID-19 pandemic utilizing micro-level S-DoT data.
IoT sensors procure big data, and it requires a certain level of data analytics accumen. Even though the S-DoT data became available to the public in 2020, S-DoT’s data is fundamentally fuzzy. It remains an obstacle for planners and researchers to utilize the data.
Likely, the study found that not all variables are well examined as described by Seoul Metropolitan Government. Analyzing the temperature and rainfall was the main obstacle for the study to utilize S-DoT’s data in Gangnam, as they were primarily given in null values. Moreover, S-DoTs installed in 2020 seem to not function well as S-DoTs installed in 2019. There were more camera detection-based S-DoTs in Gangnam in number; however, it’s hard to admit that the total examined floating population of 2020 S-DoTs is lower than 2019 S-DoTs. If the outdated one performs better, we question the rationale behind installing the newest one.
To be true, the rationale behind two types of S-DoT maybe be to serve different policy regimes. But as the reasoning nor explanation are described by Seoul Metropolitan Government’s platform, clarifying the needs of S-DoT installment remains a task to the policymakers. Otherwise, the IoT sensor installment is deemed a normative bias planning tool.
If S-DoT provides new insights, we suggest a research framework using S-DoT-based floating population data to examine travel behavior. As S-DoT provides data in a given time and space, we can identify travel volume and pattern using an S-DoT-based floating population. The analysis went through five phases to validate S-DoTs in Gangnam and examine the effects of COVID-19 on people’s travel behavior. First, as one of Seoul’s smart city planning strategies, IoT sensors- S-DoT operation in Seoul was introduced. Second, big real-time data was collected to analyze people’s travel behavior. Third, statistical analysis was conducted during the period of the COVID-19 pandemic. Fourth, the captured floating population was spatially analyzed. Lastly, a panel regression was conducted to find the effects of essential factors on the floating population in Seoul.
The key findings include the following three aspects. First, S-DoT can be implemented as an effective tool to measure the real-time floating population. However, improving the performance of camera detection-based S-DoTs remains a task. The floating population in Gangnam incrementally accumulated from the morning rush hour and dwindled after the night rush hour. This travel behavior is similar to the analysis used in mobile phone signal-based human dynamics data in Seoul [31]. Considering the two peaks in bus and metro usage individually, people who do not have residency in Gangnam visit, commute, and do their daily activities in Gangnam.
Second, the study confirmed previous findings that land use and built environment characteristics affect people’s travel behavior [13, 14, 15]. Specifically, the number of transit stations, residential, cultural, and open spaces turned out to significantly affect people’s travel behavior. Hence, public transportation usage, including bus and metro, population density, and climate factors, seem to affect travel volume.
Third, the study examined the effect of COVID-19 on people’s travel behavior. The panel regression results showed that people react more sensitively to nationwide COVID-19 spikes when compared with spikes at the city level. It seems the degree of spread of the has different effects on people’s travel behavior. During the study period, a more significant number of new COVID-19 confirmed case was being reported outside the boundary of Seoul in general. For instance, the maximum new daily reported COVID-19 case in Seoul was 359. On the same day, 1,029 cases were reported in Korea, the highest during the study period.
Conclusion
The study contributes to ongoing smart city planning strategies in Seoul and the research on the COVID-19 effects on people’s travel behavior. Among smart city implementation, IoT sensor installation has the potential to offer innovative insight because planners and researchers can collect real-time spatiotemporal data at the micro-level. We suggested a research framework using S-DoT data to explore travel behavior by measuring travel volume and pattern. The S-DoT-based real-time floating population data can be used to measure them.
Moreover, the analysis results revealed that the degree of spread of the virus seems to have varying impacts on people’s travel behavior. However, improving the performance of S-DoT and clarifying the needs for their installment remains a task to planners and policymakers. Seoul Metropolitan Government aims to install more S-DoTs in Seoul. More S-DoTs will offer an extensive amount of data in different parts of regions. We suggest policymakers review the pre-installed S-DoTs first before going further.
For future studies, we suggest examining S-DoT’s data errors. Missing data, outliers, and bias are the most common data errors in IoT sensor applications [38]. Similarly, one of the major obstacles in this study was that examined S-DoTs had missing data and outliers. Perhaps it could be neighboring land use features or climate factors like heat and high moisture humidity after heavy rainfall that affect S-DoTs’ performance. Also, it is unsure as to whether floating population data measured by S-DoTs would contribute more to apprehending real-time travel patterns better than using conventional census population or mobile phone-signal based floating population. Validation on IoT sensor data quality [38] and computational research using multiple heterogeneous data sources on IoT data [39] would improve S-DoT’s performance and help frame the rationale for installing S-DoT. Lastly, S-DoT data is openly publicized, and various stakeholders can use the data with different objectives. Therefore, it is also an opportunity to survey each sector such as the legislature, planners, or researchers, and use their feedback to structure IoT data application [40] so that future S-DoT users can efficiently utilize S-DoTs.
Nevertheless, the analysis has several limitations. First, creating a buffer to collect neighboring information can overlap with one another, which can cause biased results. Second, compared to S-DoT for the floating population, S-DoT for climate factor performed relatively poorly in Gangnam. Ideally, the climate variables should all have been curated to hourly daily data. However, S-DoT was able to troubleshoot for calculating the temperature and precipitation. Third, camera-based S-DoTs worked poor than WiFi-based S-DoTs in terms of measuring floating population data. The data is in exposure to being biased. Fourth, the study only analyzed one district in Seoul out of twenty-five districts. Perhaps, looking into the whole S-DoT throughout administrative boundaries in Seoul can provide more promising insight. We leave these tasks behind for further development.
