

List of abbreviations
Introduction
Material and Methodology
Case study selection
Generating future climate
Calibration of the building energy simulation model
Building energy simulation
Climate change adaptation measures
Results
Calibration
Climatic data analysis
Impact of climate change on building energy demand
Impact of individual adaptation measures
Impact of combined adaptation measures
Discussion of results
Conclusion
List of abbreviations
ACH Air Change per Hour
AR Assessment Report
ASHRAE American Society of Heating, Refrigerating and Air Conditioning Engineers
BES Building Energy Simulation
COP Coefficient of Performance
CV (RMSE) Coefficient of Variation of the Root Mean Square Error
DOE Department of Energy
EPW EnergyPlus Weather
GCM General Circulation Model
HVAC Heating, Ventilation, and Air Conditioning
IEA International Energy Agency
IPCC Intergovernmental Panel on Climate Change
LoE Low-Emissivity
MVHR Mechanical Ventilation Heat Recovery System
NMBE Normalized Mean Bias Error
RCP Representative Concentration Pathway
RMSE Root-Mean-Square Error
Introduction
Over recent decades, climate change has become a subject of extensive study and has attracted the attention of many researchers and scientists. It is widely acknowledged today that the main causes of climate change and global warming are anthropogenic activities which are responsible for the emission of huge amounts of greenhouse gases into the atmosphere. In this context, the fifth assessment report (AR5) of the Intergovernmental Panel on Climate Change (IPCC) [1] stipulates that there is a direct relationship between the increase in greenhouse gas (GHG) emissions in the atmosphere and the rising global temperature. Several studies have shown that the global temperature increase has numerous bad consequences on the environment and presents many serious threats to our lives. It can cause floods, drought, rainfall, desertification, hurricanes, megafires, and so on [2]. According to the International Energy Agency (IEA) [3], 36% of final energy consumption and 39% of all carbon dioxide (CO2) emissions are associated with the existing buildings and the construction sector in general, making them by far the largest contributor to global climate change. On the other hand, it has also been revealed that climate change considerably impacts the energy demand from buildings [4, 5] as well as cities.
To investigate the climate change phenomena, several researchers have developed numerical programs (algorithms, models, etc.) called General Circulation Models (GCMs) that are based on physical processes that are related to various climate system components (atmosphere, ocean, cryosphere, and land surface). These GCMs need climate scenarios that can forecast future GHG emissions [6].
It is worth emphasizing that future climate change is highly dependent on greenhouse gas (GHG) emissions. In this respect, the IPCC fifth assessment report (AR5) [1] published several emission scenarios, called Representative Concentration Pathways (RCPs) to quantify this climate change. This set of scenarios can be used to predict the development of certain socio- economic factors such as economic development, energy use, population growth, land use, and technological progress [7]. In addition, these scenarios, which represent the data inputs to the GCMs, are divided into four main variants, namely RCP2.6, RCP4.5, RCP6.0, and RCP8.5, by their total radiative forcing in the year 2100. Table 1 gives more details about the characteristics of each scenario. Note that the RCP2.6 scenario, which has a very low radiative forcing, turned out to be unachievable and was therefore discarded from various models and research [8].
Table 1.
Summary of RCP scenarios
In recent decades, a great deal of research has been conducted to assess the impact of climate change on buildings [9, 10, 11, 12]. In this regard, Berardi et al. [13] investigated the impact of climate change on future heating and cooling energy demand in the city of Toronto (Canada). The authors used sixteen ASHRAE prototype buildings as case studies. The results showed that the energy consumption for heating will decrease by an average of 18% to 33% by 2070. However, the energy consumption for cooling is expected to increase by 15% to 126% over the same period. Likewise, the results reported in several studies indicated that the impact of climate change is highly dependent on the geographical area [14, 15, 16, 17]. For this reason, it was deemed necessary to carry out the investigations at the regional scale [18, 19]. In Australia, Wang et al. [20] studied the impact of climate change on heating and cooling energy consumption, according to different configurations of a residential building, using three stabilization emission scenarios, i.e. A1B, A1FI, and 550 ppm, in five different climate zones. The findings suggested that in cooling dominated climates and heating and cooling balanced climates, there will be a significant increase in energy demand compared to that found in heating dominated climates. Indeed, the city of Sydney, which has a temperate climate, was found to be the most affected by climate change, with an increase in energy needs between 112 and 350% by the year 2100 as compared to the current energy need levels.
It is worth noting that today the Mediterranean zone is considered very sensible; it is one of the most exposed areas to climate change [21, 22].
Recently, several experts have predicted that this region will experience a temperature increase of 20% over the global annual average. This increase will be around 50% in summer [23].
Consequently, this warming phenomenon will certainly have a significant impact on future energy demand for heating and cooling [24]. Regarding Cellura et al. [25], they simulated the impact of climate change on energy consumption in office buildings located in fifteen cities in southern Europe, a region that is characterized by the Mediterranean climate. The investigation established that the annual heating and cooling energy demand would increase within the range extending from 50.8% to 119.7% by the year 2090.
According to the literature, two main strategies can be utilized in dealing with climate change: Mitigation and Adaptation [5, 8, 26]. Mitigation uses all possible measures to make the effects of climate change lighter, by stopping or limiting the greenhouse gas emissions into the atmosphere, while adaptation is viewed as the action of reducing the impacts of climate change and providing a building with an adequate indoor environment. Therefore, it can be asserted that implementing one of the two strategies may be viewed as a co-benefit for the other. Several studies have proposed and evaluated climate change adaptation measures on existing buildings [27, 28]. In this context, Pérez-Andreu et al. [29] assessed six passive and two active energy-saving measures under two emission scenarios and two GCMs for the years 2050 and 2100. Based on the energy- saving criteria, they concluded that increased thermal insulation and low infiltration have the greatest impact on reducing the energy demand. Additionally, in a study conducted in South Korea [30], C. Kwon analyzes the energy requirements of office buildings based on window area ratios and canopy shade length, in preparation for future climate change scenarios. Energy demand simulations were conducted for four different years (2000, 2020, 2040, and 2060) based on the medium emission scenario of carbon dioxide (A1B). The main finding of the study is that the window area ratio has a significant impact on energy consumption in offices. Specifically, a 30% increase in window area leads to a 20 kW/m2 increase in energy consumption per unit area per year. By 2060, this difference is projected to increase to 25 kW/m2. Also, the study suggests that installing awnings can be effective to decrease cooling energy. Similarly, Huang and Hwang [31] performed several simulations using EnergyPlus to evaluate the impact of climate change on the cooling energy use in a typical residential building in Taiwan. The resulting data showed an increase in the cooling energy. These increases were estimated at 31%, 59%, and 82% for the future projections of the years 2020, 2050, and 2080, respectively. Then, five passive strategies were applied to counteract this impact and reduce the cooling energy consumption. The results also indicated that all proposed measures are required to avoid any energy cooling increase. Furthermore, similar studies have been carried out in the Netherlands by Van Hooff et al. [32] who proposed six passive climate change adaptation strategies to increase the comfort of occupants of three residential building types, for two different construction periods. They used the overheating hours over a year as an indicator of performance. In another research study, Van Hooff et al. [33] utilized the heating and cooling energy demand as an indicator to assess the impact of climate change on a terraced house. The results from both studies suggested that among all the measures implemented in this study, the exterior solar shading and natural ventilation were the most effective. With regard to Invidiata and Ghisi [34], they assessed the impact of climate change on energy use and thermal comfort in three Brazilian cities using the EnergyPlus program. The authors showed that passive climate change adaptation strategies, such as sun protection, low solar absorption, and thermal insulation, could reduce cooling and heating energy use by 50% in 2080. Moreover, through a cost-effectiveness analysis, Ren et al. [35] investigated the climate change adaptation measures for existing and new residential buildings based on energy consumption and GHG emissions in eight Australian cities. They concluded that in areas where heating is predominant, increasing the energy efficiency of the building envelope could greatly enhance the adaptation of buildings to climate change. However, in cooling-dominated and in heating and cooling balanced zones, further measures are required, including energy-efficient air conditioners and appliances, in addition to installing solar panels. In another study, Nematchoua et al. [36] examined the effectiveness of thermal insulation in hospital buildings located in six different Indian Ocean cities, through three parameters, i.e., thermal performance, energy demand, and energy cost, according to three climate scenarios (B1, A1B, and A2). The findings suggested that the cooling energy demand is expected to increase between 60.8% and 95.1% by 2090, while thermal insulation use may reduce the energy demand by 40% in all cities. Further, Osman and Sevinc [37] evaluated several resilient building design strategies in a hot arid climate to counter the climate change impacts in the city of Khartoum (Sudan). The results obtained evidence that, by 2070, natural ventilation and active heating will not be advantageous design strategies for all seasons. Meanwhile, it has been revealed that the most important measure is the two-stage evaporative cooling. As for Waddicor et al. [5], they considered the impact of climate change and the ageing of buildings and equipment in estimating the future heating and cooling energy demand of a library in Italy. Then, a combination of retrofit measures was implemented to mitigate the energy demand. Hence, it was concluded that an appropriate combination of measures could decrease the cooling energy demand by 87.3% in future conditions. Similarly, Pajek and Košir [38] examined the effectiveness of passive design strategies for heating and cooling energy consumption in residential buildings in the most typical European climates. Furthermore, they found out that reducing the window-to-floor ratio was the most effective global measure for mitigating the expected effects of climate change. The study also indicated that it is difficult to entirely counteract the impact of climate change on buildings using passive measures, although it is possible to achieve low energy consumption, especially in warm, temperate, and oceanic climates. In the United Kingdom, Porritt et al. [39] analyzed the effects of a set of passive intervention strategies to prevent residential buildings from overheating by the year 2080. They found out that wall insulation strategies for reducing solar heat gains, such as external shutters and light-colored external walls, could be the most efficient measures to minimize overheating. Regarding Nik and Kalagasidis [40], they carried out a study where they reported on the ranking of climate uncertainties related to the impact of climate change in the city of Stockholm (Sweden). They also showed that natural ventilation can be an effective measure to counteract the increased cooling demand, in future climate conditions.
It is worth emphasizing that in all these studies, climate change adaptation measures were generally assessed to achieve the lowest possible heating and cooling energy consumption. However, although it is very important today to investigate the impact of climate change on buildings at the local level, very limited knowledge exists about the impact of climate change on buildings and the effect of adaptation measures on heating and cooling energy demand in buildings in Algeria though it is located in a highly sensitive region to climate change.
Furthermore, while the Passivhaus EnerPHit Standard is considered, by many scholars as well as public and private stakeholders, as the way forward to decarbonize the building stock [41], very few studies have investigated the use of the EnerPHit Standard with future climate conditions. To the best of our knowledge, not much research has been conducted on this topic except for the study that was carried out by Duran and Lomas [42] who evaluated the effects of some office building retrofitting strategies by comparing the results of the PartL2B building regulations and those of the EnerPHit standards, for the current and 2050 climates, in the UK.
It should be noted that Passivhaus EnerPHit is a standard that was developed by the Passivhaus Institute [43]. This standard was established for the retrofitting or refurbishment of existing buildings using Passive House components; it aims primarily at improving the thermal performance of the building envelope, increasing airtightness, and reducing thermal bridges. In addition, ventilation could be optimized by using a mechanical ventilation system with heat recovery to reduce energy consumption and achieve adequate indoor thermal comfort.
At the same time, the Algerian Ministry of Interior has launched a program to equip schools with solar photovoltaic panels and solar thermal collectors to supply electricity for lighting and hot water. However, this program does not consider heating and air conditioning.
It is worth recalling that this study aims primarily to evaluate the impact of climate change on the heating and cooling energy demand of a tertiary building in the Mediterranean climate zone and to assess the effectiveness of several climate change adaptation measures using the energy requirements of the international Passivhaus EnerPHit Standard, according to two IPCC’s future scenarios, i.e. RCP4.5 and RCP8.5, in the years 2050 and 2080. It is important to note that the EnerPHit Standard sets the maximum limits of 20 kWh/m2/year, and 15 kWh/m2/year, for heating and cooling energy demand, respectively, in warm-temperate climates. It also allows determining the thermal properties of various building components.
This paper is structured into five major parts. Section 2 describes the methodology used. Next, sections 3 and 4 present and discuss the results of the study. Then, section 5 gives a conclusion.
Material and Methodology
Case study selection
The case study under investigation is a high school building, situated in Zenata, in the city of Tlemcen (Algeria). Its geographic location makes it belong to the Mediterranean climate zone (Csa according to Köppen’s classification [45]).
The building was built in 2016 and is divided into three main sections; two sections for educational purposes and a central section for the administration, as illustrated in Figure 1. The educational sections have two levels, hosting mainly classrooms, laboratories, a computer laboratory, and an auditorium. It should be emphasized that the administrative section has 3 levels. The school was chosen in relation to its representative model and also to the construction materials used. General information about the case study is presented in Table 2.
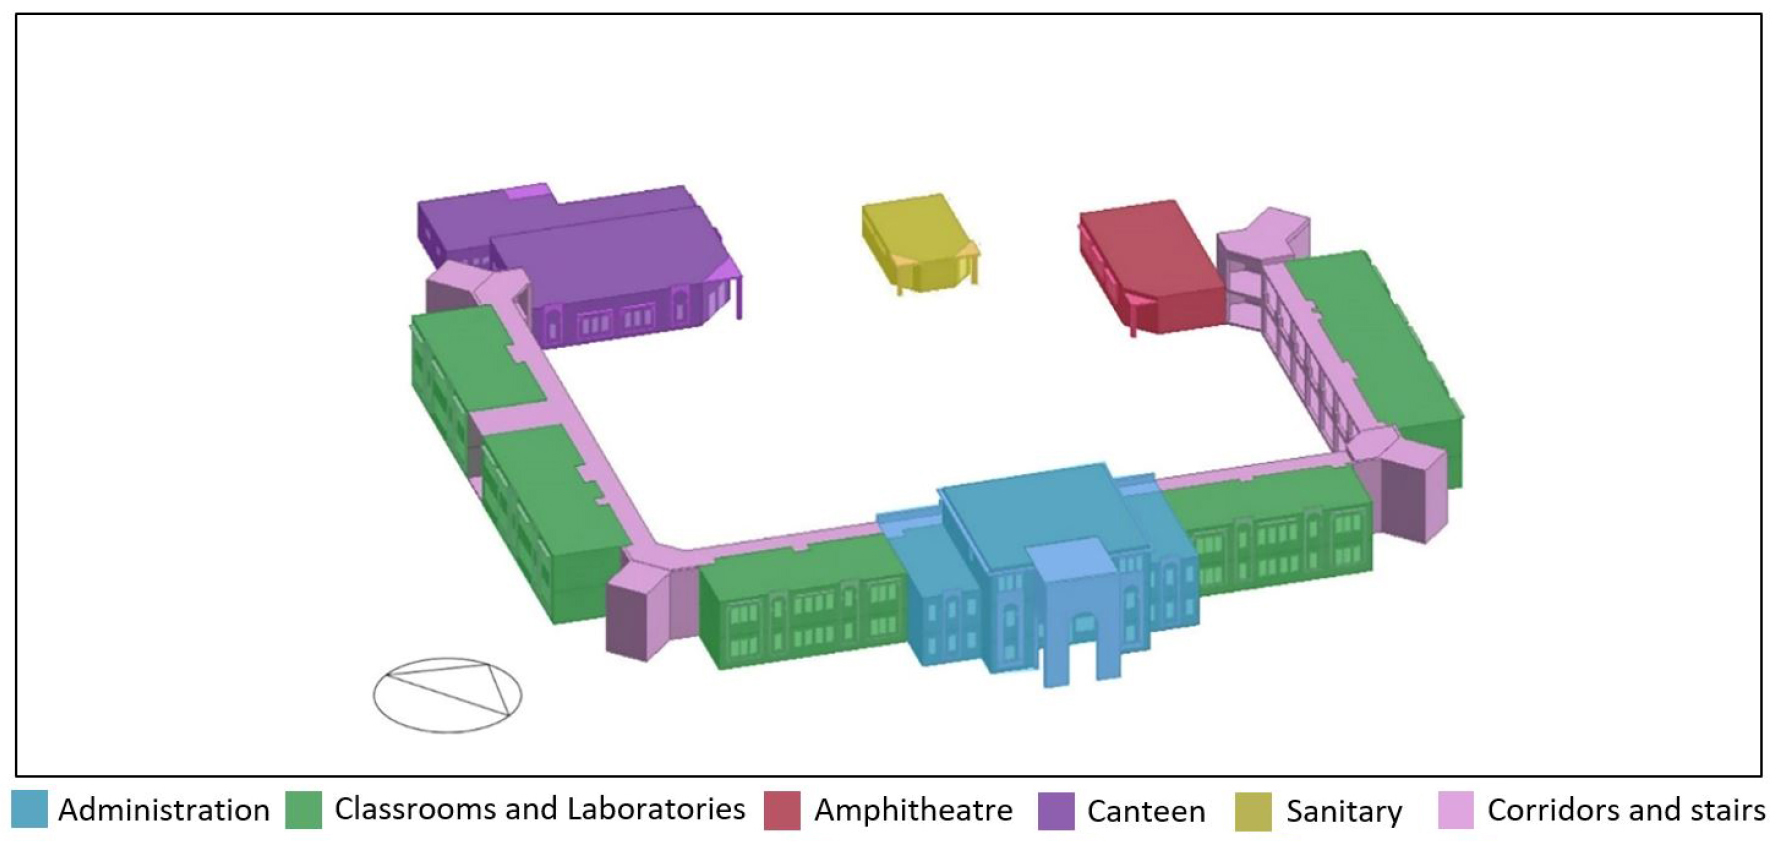
Table 2.
General information about the case study building
The building was constructed with reinforced concrete structure and brick masonry walls. The ground floor slab is made of reinforced concrete laid on the ground. The intermediate floors and the roof are made with reinforced concrete and hollow blocks, without any thermal insulation. The windows have wooden frames with single glazing of 3 mm thickness. Table 3 summarizes the main constructive characteristics of the case study building. This building is equipped with two natural gas boilers. Each boiler has a nominal capacity of 290 kW, with a COP of 85%; it operates with two hot water recirculating pumps. Note also that this heating system is not provided with a temperature control system. It is generally turned on in November and off in March. Regarding the cooling system, five split air conditioner units are installed in the Head of School’s office, the secretaries and accountant’s office, the meeting room, and the auditorium. This school does not have a mechanical ventilation system; it is naturally ventilated. The occupancy schedule was defined according to the staff and students’ occupancy.
Table 3.
Main characteristics of the building components
Generating future climate
In this study, Meteonorm 8.0.3 [46] software was used to generate the current climate, which corresponds to a typical meteorological year using the recorded data, as well as the future climate projections. Meteonorm combines the current weather database, the interpolation algorithms, as well as the weather generator to stochastically generate typical years with hourly or minutely time resolution data, for any location in the world [47, 48] and in several formats, including the EnergyPlus Weather (EPW) format. This Meteonorm version provides historical data, contemporary data, and several future time slices until the year 2100. It also incorporates three representative concentration pathway (RCP) scenarios, i.e. RCP2.6, RCP4.5, and RCP8.5, by averaging ten global climate models data that were adopted in the fifth IPCC Assessment Report (AR5). This program provides a number of parameters, such as air temperature, relative humidity, radiation, and wind speed, in addition to some others that are required for energy simulation [49]. In this study, the contemporary data, which correspond to averages over a period of twenty years, were used to represent the current climate, while the scenarios RCP4.5 and RCP8.5 were used to project future climates for the years 2050 and 2080. Meteonorm has been widely applied in several energy-related research studies to get historical and current climate data sets [50, 51, 52, 53, 54] and to forecast future climate as well [55, 56, 57, 58].
Calibration of the building energy simulation model
Calibration of the simulated model is generally required to ensure that the behavior of the simulated model corresponds to a real building [59, 60]. For this reason, the calibration and validation of the building energy simulation model were carried out in this study by comparing the measured indoor temperature with the simulation results. In addition, the indoor and outdoor temperatures were monitored during the three hottest months (June, July, and August), even when the school was not occupied. The outdoor dry-bulb temperature was obtained by averaging the data recorded by two sensors which were placed at different locations to minimize uncertainty. This temperature was then incorporated into the weather file for the calibration of the building energy simulation model. This weather file was then used to run the simulations and get the primary results. The results obtained from the simulation were then compared with the recorded data. The calibration process was performed according to the ASHRAE guidelines [61] which consider that the building energy simulation (BES) model is well- calibrated if the normalized mean bias error (NMBE) and the coefficient of variation of the root mean square error (CV (RMSE)) are within the ranges ±5% and 15%, respectively, based on monthly data, and within ±10% and 30%, respectively, when dealing with hourly values, as summarized in Table 4.
Table 4.
Calibration tolerance values according to ASHRAE guideline 14 [59]
| Index | NMBE | CV (RMSE) | ||||||
| Calibration Data | Monthly | Hourly | Monthly | Hourly | ||||
| Tolerable value (±) % | ±5 | ±10 | 15 | 30 | ||||
The operating schedules of the present heating and cooling, lighting, and HVAC systems were selected based on an in-situ survey and using documents provided by the high school administration. As for the monitoring task, the data loggers were placed in three classrooms: classroom 1 has an east-west orientation, while classrooms 2 and 3 both have a north-south orientation.
Consequently, the normalized mean bias error (NMBE) and the coefficient of variation of the root mean square error (CV (RMSE)) may be calculated using Equations (1) and (2) given below [62]:
Where is the measured data, is the simulated data, is the number of measured values, and is the average of measured data.
Building energy simulation
The DesignBuilder software [44] was used to assess the effectiveness of the EnerPHit strategies to adapt the building to climate change conditions. It should be noted that DesignBuilder is an energy simulation program that uses the EnergyPlus simulation engine that is provided by the United States Department of Energy (DOE), with a graphical user interface. In addition, the dynamic simulations were carried out at hourly intervals, according to two IPCC AR5 representative concentration pathways, i.e. RCP4.5 and RCP8.5, during the two timeframes of 2050 and 2080. The ventilation rate of the building was fixed at 8 l/second/person [63, 64].
Based on the EnerPHit Standard, the heating and cooling set-points were assumed to be equal to 20°C and 25°C, respectively.
Climate change adaptation measures
To investigate the effect of each measure on the heating and cooling energy demand, six strategies, corresponding to adaptation measures, were assessed separately. Afterward, they were combined in a stepwise process and evaluated to reach the EnerPHit Standard. The characteristics of all measures evaluated in this study are reported in Table 5.
Table 5.
Description of the adaptation measures considered in this study
Description of adaptation measures under consideration
The first adaptation measure to be considered is the external insulation of the envelope of the building. For this, it was decided to insulate the external wall and roof, with 70 mm and 80 mm of polyurethane, respectively. Table 6 summarizes the main characteristics of the external envelope insulation measures used in this study.
Table 6.
Characteristics of the building elements corresponding to adaptation measure 01
| Element |
Insulation material |
Material thickness |
U value (W/m2K) |
| External wall | polyurethane | 70 mm | 0.29 |
| Roof | polyurethane | 80 mm | 0.3 |
| Windows | Triple-glazing | 6mm/13mm argon | 1.0 |
Note that the adaptation measures were adopted as they comply with the EnerPHit criteria, following the building component method for warm-temperate climates, as shown in Table 7.
Table 7.
EnerPHit criteria for the building component method for the warm-temperate climate [43]
The second adaptation measure consisted in replacing the existing single-glazed windows. To comply with the criteria given in Table 7, the existing windows were replaced by low-emissivity (LoE) triple-glazed windows, with a U-value = 1.0 W/m2K (Table 5). The third measure was to improve the airtightness of the building to 0.8 ACH50 (air change rate per hour with a pressure difference of 50 Pascals). This can be achieved by reducing the infiltration of doors and windows. It is important to mention that the airtightness limit required by the EnerPHit standard is 1 ACH50. The fourth adaptation measure involves the introduction of night ventilation during the warm and mid-seasons (from April to October). The fifth measure consisted in adding horizontal fixed overhangs of a 1-meter span above the windows, on the east, south, and west facades of the building to reduce heat gain. Finally, the sixth adaptation measure was about installing a mechanical ventilation heat recovery (MVHR) system with an economizer. The economizer increases the amount of air blown into the building to refresh it when outdoor conditions are favorable. This would contribute to reducing air conditioning consumption. The efficiency of the heat recovery unit is estimated at 85%. It recovers heat from the indoor air to preheat the incoming outdoor air. The mechanical ventilation system allows using the mixed-mode ventilation with the zoned control system; it switches off natural ventilation when outdoor conditions are unfavorable and turns on the active systems. This option mainly aims to minimize energy consumption.
Combined adaptation measures
Once the adaptation strategies were assessed separately, their combinations were then assessed in a stepwise process to reach the EnerPHit Standard.
The gradual implementation of the adaptation strategies used in this study follows the Passivhaus fabric-first approach to energy efficiency which prioritizes thermal renovation of the building envelope and airtightness before adding the active measures. This method has also been adopted by Liu et al. [65], with different measures and different steps, to retrofit a Chinese residential building to EnerPHit Standard, with the current climate. Table 8 summarizes the combinations of adaptation measures following an incremental process.
Table 8.
Examination of the combined adaptation measures
Results
Calibration
As previously mentioned, the recorded outside air temperature was introduced into the weather data file. The data from in-situ investigations were used as input, and then several simulations were run for different infiltration rates. After, the recorded data and simulated data were compared to determine the most accurate infiltration rate that corresponds to the real situation. After several simulations, the most appropriate infiltration rate was set at 2 ACH (air change per hour under natural conditions). The comparison between the monitored and simulated hourly indoor dry temperature for classroom 3 is displayed in Figure 2. As is indicated in Table 9, the calculated normalized mean bias error (NMBE) and the coefficient of variation of the root mean square error (CV(RMSE)) for each classroom are all within the acceptable range set by ASHRAE Guideline 14 [61]. In addition, the performed comparisons suggest that the indoor dry bulb temperature trend is similar to the outdoor temperature trend.
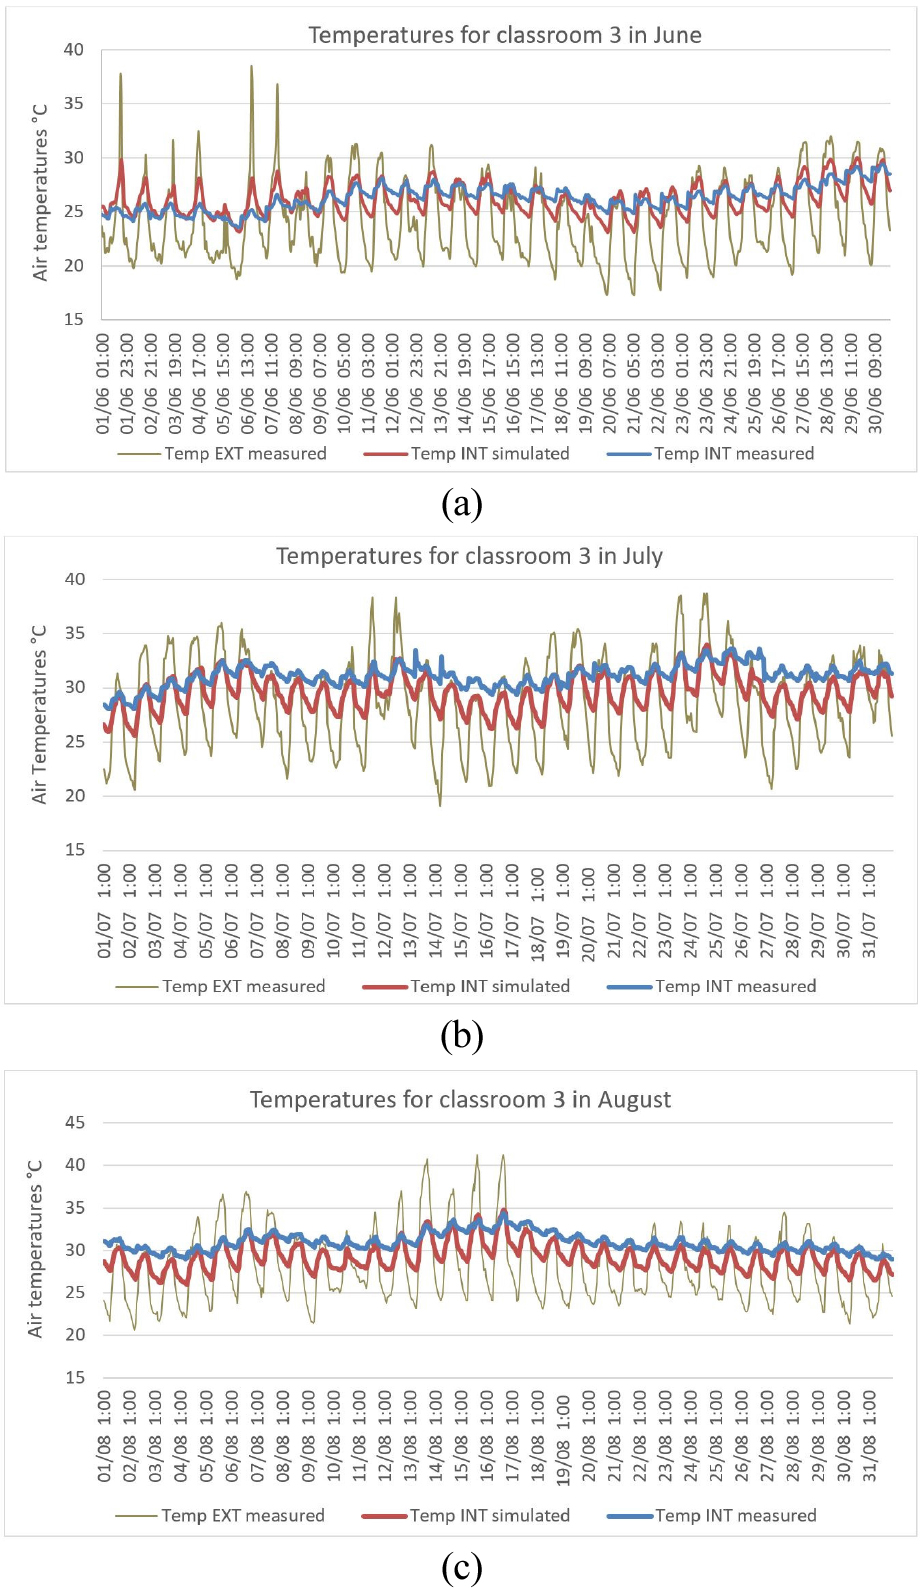
Table 9.
Calibration results of the building energy simulation (BES) model as compared to the ASHRAE guideline 14 [61] limits
Climatic data analysis
Meteonorm software was used to generate the climate data for three main periods: current, 2050, and 2080. Figure 3 shows a comparison of the mean monthly outdoor dry bulb temperatures according to two scenarios: RCP4.5 and RCP8.5. The results obtained suggest that for scenario RCP4.5, the annual mean outdoor air temperature is expected to increase by 1.1°C, by 2050, while this temperature rise would be 1.9°C in 2080 as compared to the current data.
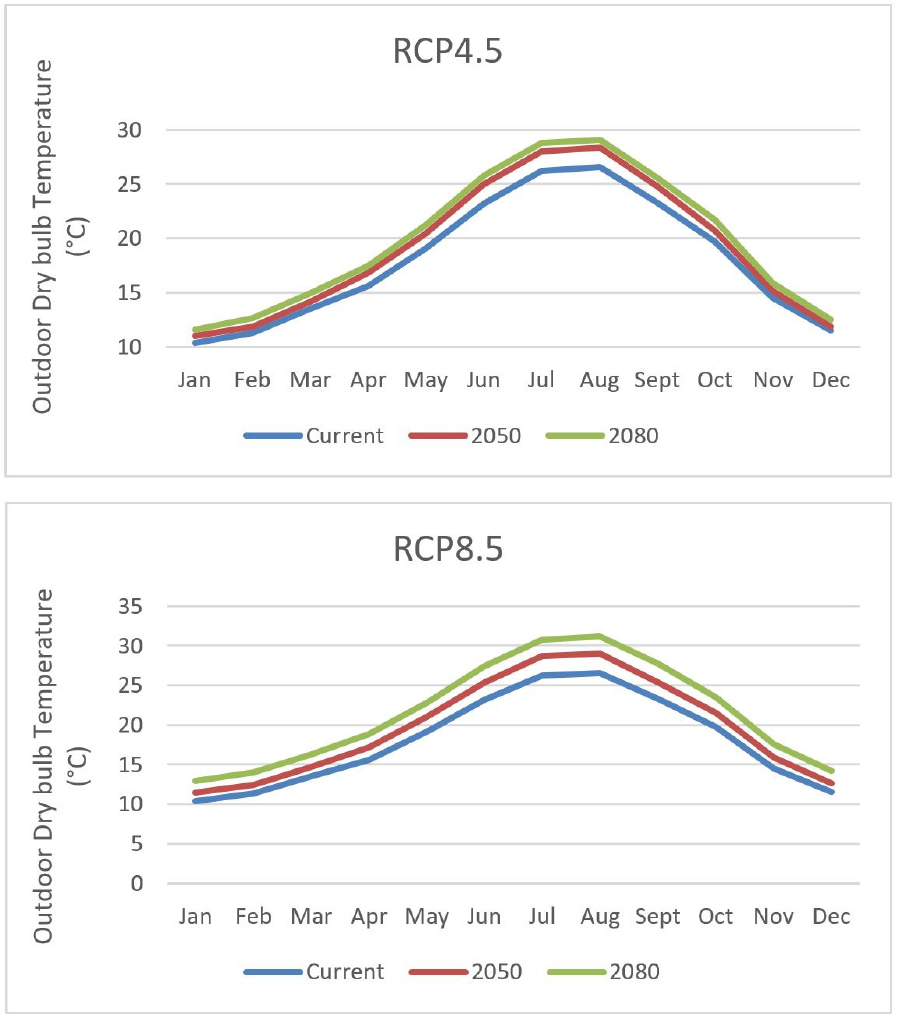
On the other hand, the outdoor air temperature is expected to increase even further for the scenario RCP8.5, with 1.7°C by 2050, while the relative highest annual mean dry bulb temperature value will rise by 3.5°C by 2080.
Impact of climate change on building energy demand
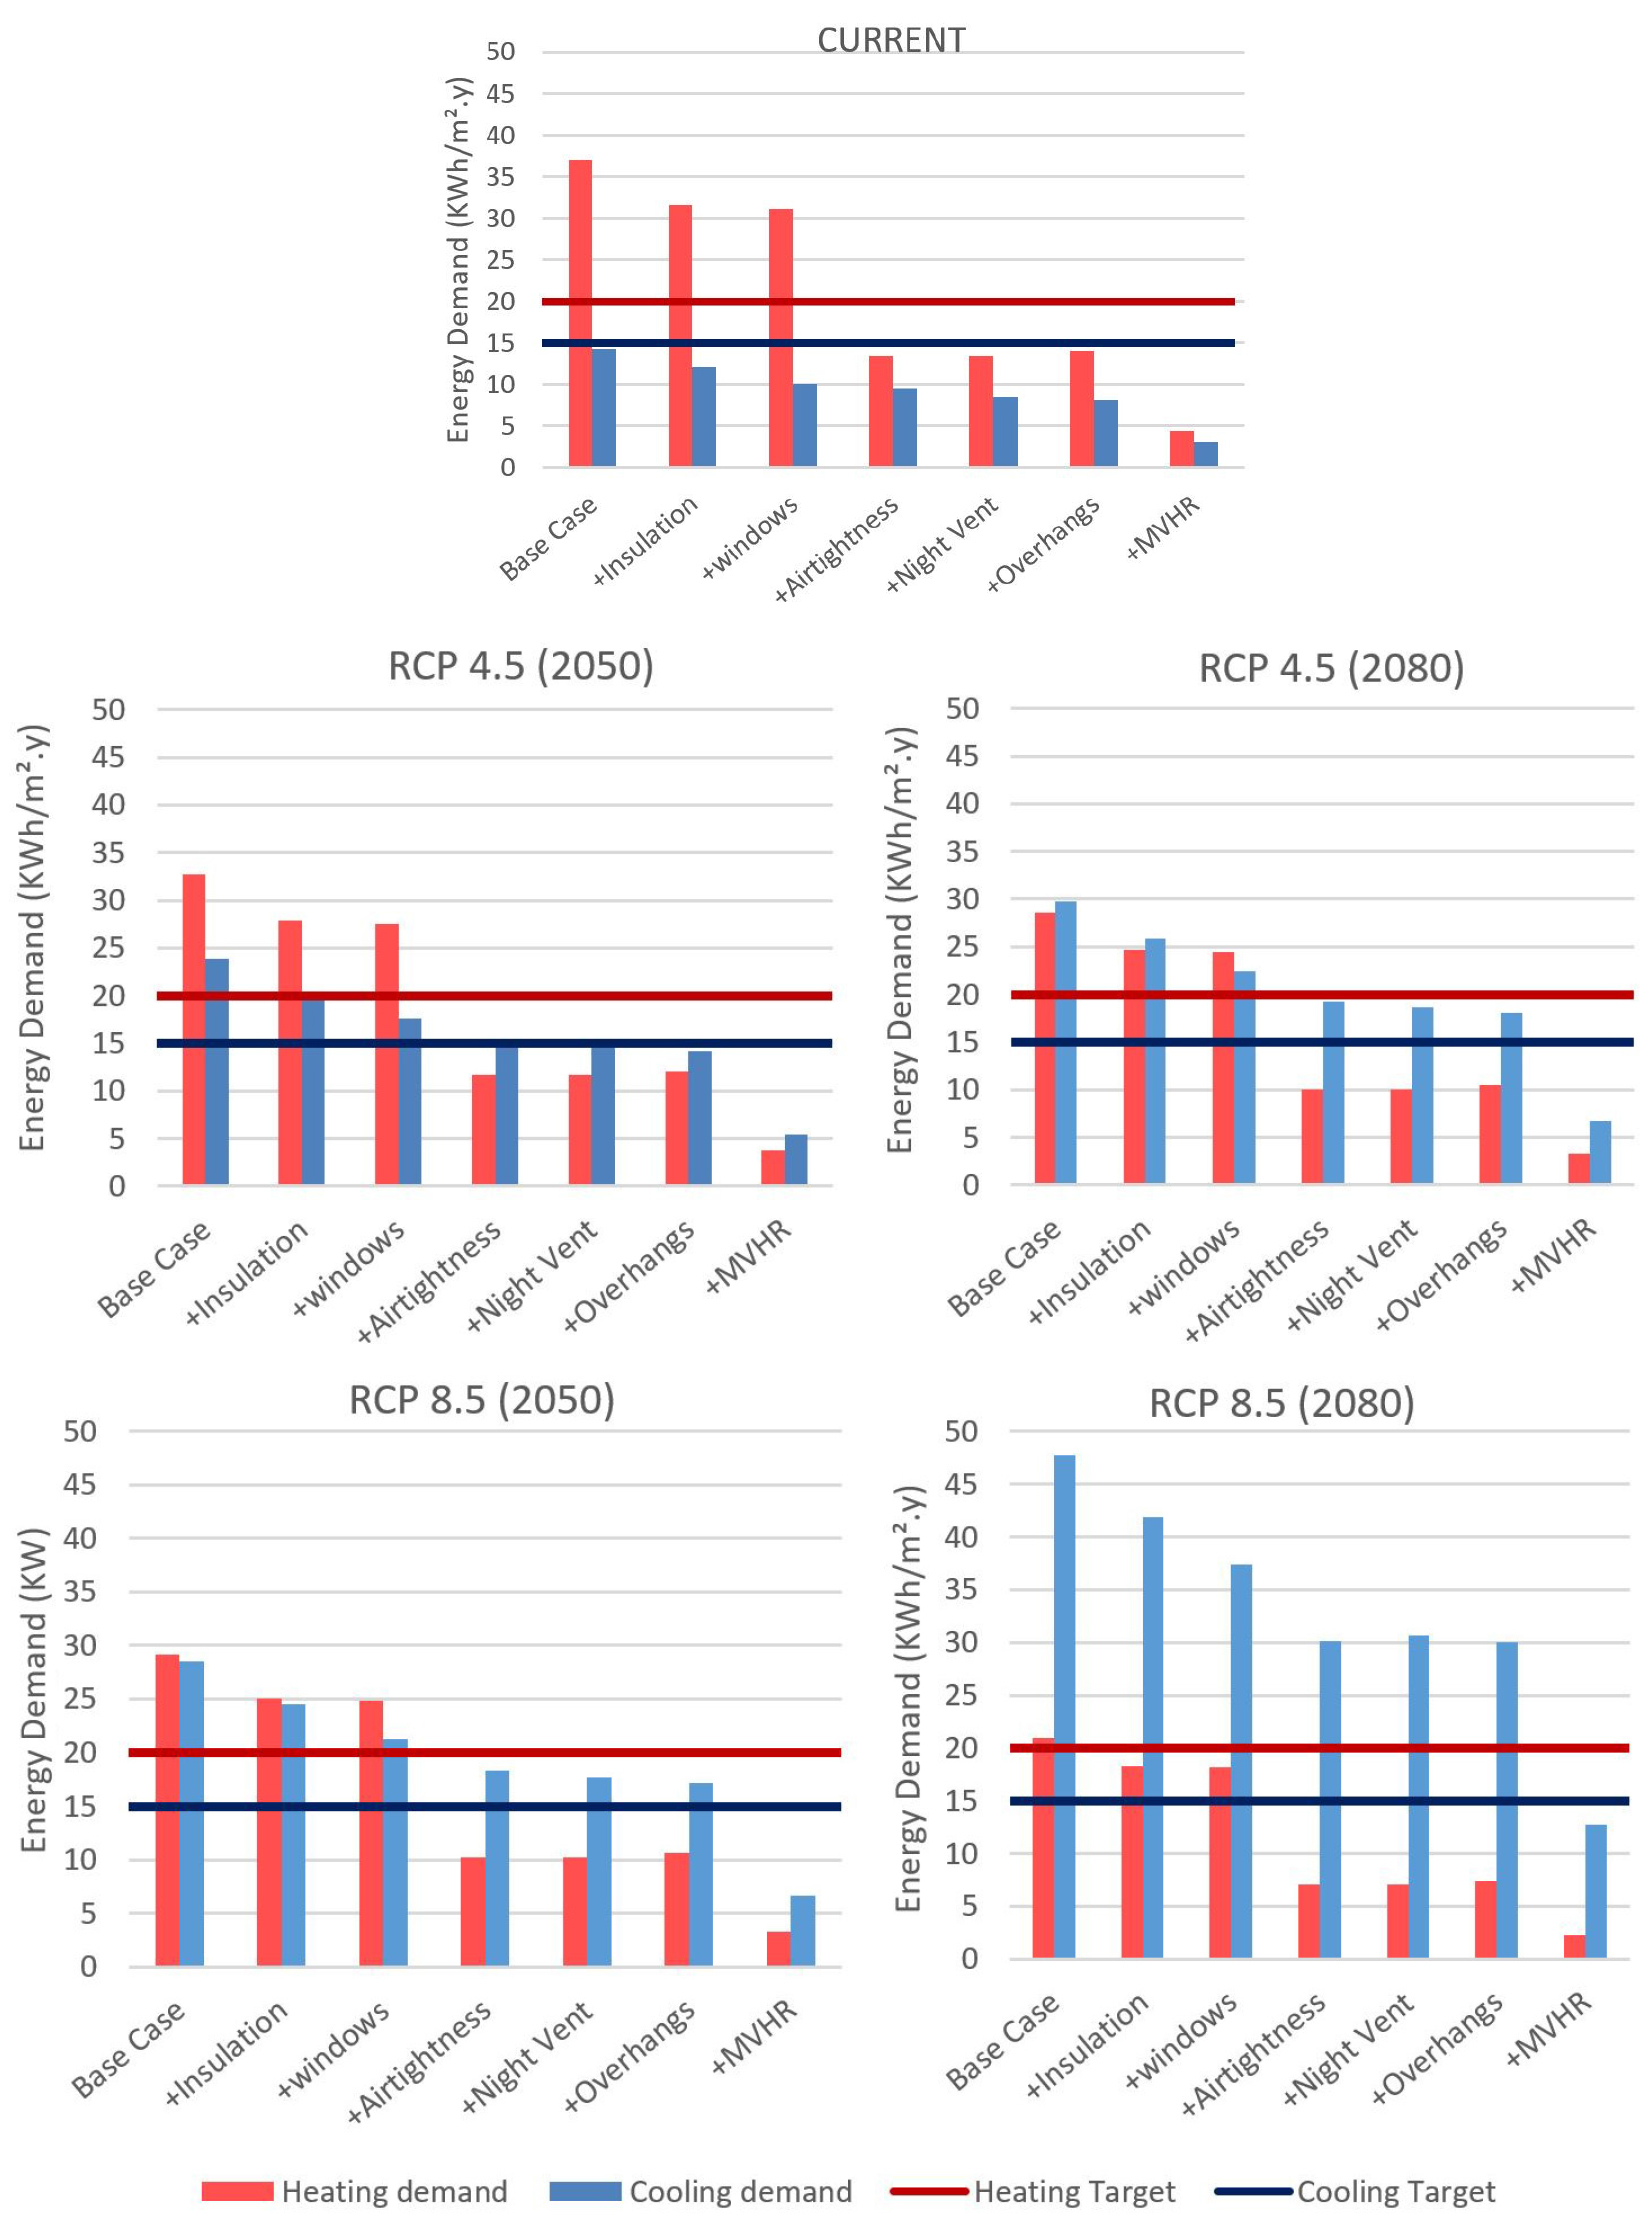
This section presents the findings about the impact of climate change on energy demand. Figure 4 displays the variation of the heating and cooling energy demand for the current situation and future conditions, according to the scenarios RCP4.5 and RCP8.5, for 2050 and 2080.
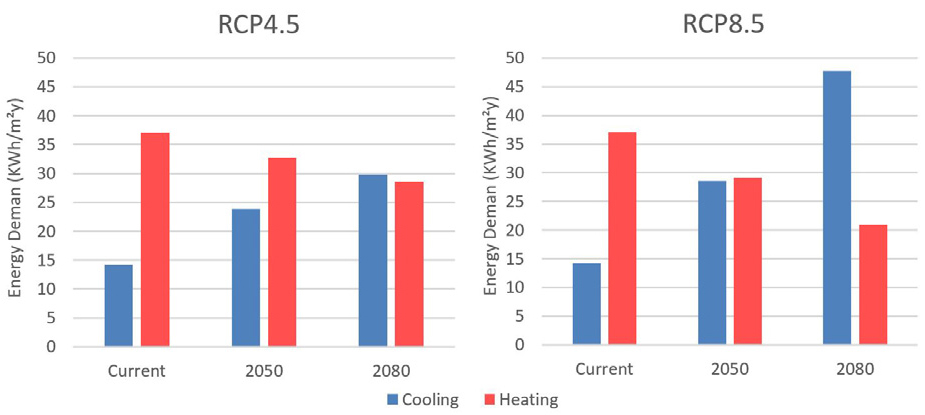
The results obtained show that, for all scenarios, the heating energy demand decreases while the cooling energy demand increases, by 2050 and 2080, in comparison with the current situation. Note that under scenario RCP4.5, the heating energy demand will decrease by 11.84% in 2050, while in 2080 this value is expected to reach 22.90%. Besides, an additional decline in heating energy demand is expected to occur under scenario RCP8.5, with 21.42% by 2050, and 43.54% by 2080.
On the other hand, climate change will engender a higher cooling energy demand under all scenarios. Indeed, the cooling energy demand will increase by 67.63% and 109.64%, by 2050 and 2080, respectively, under scenario RCP4.5. However, under scenario RCP8.5, the cooling energy demand is expected to increase by 100.77% in 2050 and 235.89% in 2080, concerning the current situation.
Impact of individual adaptation measures
Tables 10 and 11 give respective comparisons of the effectiveness of individual adaptation measures on the annual heating and cooling energy demand concerning the base case situation of the current climate, and those of 2050 and 2080, according to the scenarios RCP4.5 and RCP8.5. The prefix “-” represents an energy demand decrease, while the prefix “+” refers to an energy demand increase.
Table 10.
The effectiveness of each individual adaptation measure on the heating energy demand as compared to the base case, according to current and future scenarios
Table 11.
The effectiveness of each individual adaptation measure on the cooling energy demand as compared to the base case, according to current and future scenarios
It is easy to note that, regarding the base case, only the cooling energy demand in the current climate is lower than the EnerPHit threshold. It should be noted that, the cooling energy demand exceeds the EnerPHit threshold under all the other scenarios. Concerning the heating energy demand, the results show that the EnerPHit limit is exceeded in all scenarios as compared to the base case.
As a first intervention, the external envelope of the building was insulated using polyurethane of a thickness of 70 mm for the external wall and 80 mm for the roof. This adaptation measure is supposed to decrease both the heating and cooling demand. Under scenario RCP4.5, the heating energy demand is expected to decrease by 14.75% and 13.86%, by 2050 and 2080, respectively. Likewise, the cooling energy demand could also be diminished by 14.19% in 2050 and 13.36% in 2080, when using external insulation.
Under scenario RCP8.5, the heating demand decreases by 13.83% and 12.71%, by 2050 and 2080, respectively. The cooling energy demand diminishes by 13.95% and 12.36%, by 2050 and 2080.
The next adaptation measure is to replace the existing single-glazed windows with low-emissivity (LoE) triple-glazed units. Table 11 explicitly shows that this retrofitting measure has no significant impact on the heating energy demand. However, it was found that this measure has some impact on the cooling energy demand. For example, under scenario RCP4.5, this cooling energy demand drops by 7.68% by 2050.
With regard to airtightness, it is improved to 0.8 ACH50 which is less than the value required by the EnerPHit Standard (1 ACH50). Improving airtightness can help to reduce both the heating and cooling energy demand. According to scenario RCP4.5, the heating energy demand will decline by 45.53% and 47.2%, in 2050 and 2080, respectively. However, under scenario RCP8.5, the heating energy demand would drop by 47.2% and 50.5%, by 2050 and 2080, respectively. On the other side, it was found that improved airtightness can help to reduce the cooling energy demand by 4.45% in 2050 and by 6.88% in 2080, according to scenario RCP4.5. As for scenario RCP8.5, this measure is expected to reduce the cooling energy demand by 6.24% by 2050 and 11.84% by 2080.
Table 5 shows that natural ventilation reduces the cooling energy demand in all future scenarios. The cooling energy demand reduction ranges from 2.77% to 5.12%. Note that night ventilation does not have any effect on the heating energy demand.
Furthermore, it is worth indicating that the addition of overhangs increases the heating energy demand but reduces the cooling energy demand. According to scenario RCP8.5, the heating energy demand will increase by 2.51% and 2.77%, by 2050 and 2080, respectively. However, the cooling energy demand will decline by 3.26% in 2050 and by 2.41% in 2080, according to the same scenario, as compared to the base case scenario.
The last adaptation measure is the installation of a mechanical ventilation system with a heat recovery unit with 85% efficiency, and an economizer system. The use of a mechanical ventilation system allows using ventilation in the mixed mode. It should be mentioned that the combination of the MVHR system and controlled natural ventilation has a significant impact on energy demand reduction. Note that, under scenario RCP4.5, the heating energy demand will be reduced by 50.58% and 51.47%, by 2050 and 2080, respectively. However, under scenario RCP8.5, this value would be 51.01% in 2050 and 51.65% in 2080. With regard to the cooling energy demand, the use of the economizer and mixed-mode ventilation can also have a considerable impact on the cooling energy demand; it will cause a reduction of 32.79% in 2050 and 33.43% in 2080, according to scenario RCP4.5. As for scenario RCP8.5, these measures will lead to a decrease of 33.51% in 2050 and 34.99% in 2080.
Impact of combined adaptation measures
Tables 12 and 13 present the effectiveness of combined adaptation measures on yearly heating and cooling energy demand by comparing the results of the current situation with those of 2050 and 2080, according to the scenarios RCP4.5 and RCP8.5.
Table 12.
Percentage of the heating energy variation in comparison with the base case for the current climate and four different future scenarios (RCP4.5 for 2050 and 2080, and RCP8.5 for 2050 and 2080)
Table 13.
Percentage of the cooling energy variation in comparison with the base case for the current climate and four different future scenarios (RCP4.5 for 2050 and 2080, and RCP8.5 for 2050 and 2080)
The combination of all individual measures allows reaching the value of 2 kWh/m2y for the heating energy demand, and 5 kWh/m2y for the cooling energy demand, thus causing a reduction of 70% and 50% for the heating and cooling energy demand, respectively. These results are well below the EnerPHit energy limits of 20 kWh/m2y for heating and 15 kWh/m2y for cooling in the climate zone under consideration.
Figure 5 shows the heating and cooling energy demand, according to the EnerPHit Standard limits which are indicated by a red line for the heating energy limit, and a blue line for the cooling energy limit.
Discussion of results
Most climate change adaptation studies reported in the literature are relatively basic and superficial. Most of them did not aim to reach the energy limits of any specific standard. The originality of this study lies in the evaluation of the impact of climate change on heating and cooling energy demand in tertiary buildings in Algeria. Indeed, this study seeks to assess the effectiveness of the adaptation measures in order to reach the energy limits established in the Passivhaus EnerPHit Standard for both current and future climate conditions.
This paper examines the case of a high school in the Wilaya (Province) of Tlemcen (Algeria) to assess the effectiveness of the EnerPHit Standard to adapt buildings to climate change. Six adaptation measures were implemented in a gradual (stepwise) process and their effectiveness is discussed here. The energy simulations were performed under current conditions, and for two climate projections, i.e., 2050 and 2080, under the scenarios RCP4.5 and RCP8.5. The base case corresponds to the actual situation of the building, without adaptation measures.
The first adaptation measure is the insulation for the external envelope of the building, using 70 mm for the walls, and 80 mm of polyurethane for the roofs. With more than 13% of average energy savings, one can say that external insulation is an effective measure in reducing both the heating and cooling energy demand, under all scenarios. It also allows reaching the EnerPHit heating limit for the RCP8.5 scenario in 2080. These results are consistent with those reported by authors of many research studies [33, 66, 67, 68]. These researchers found that insulation has a beneficial effect on the heating energy demand under future conditions. However, some other studies [31, 36], which were carried out in regions where cooling is predominant, reported that insulation has a significant effect on reducing the cooling energy demand. As Algeria is located in a heating and cooling balanced region, the impact of the insulation measure on heating and cooling energy saving is almost the same.
The findings about the replacement of the existing single-glazed windows with low-emissivity (LoE) triple-glazed windows indicated that this measure engenders a very slight decrease (about 1%) in heating. However, this same measure plays an essential role in reducing the cooling energy demand. The results obtained are in good agreement with those of Waddicor et al. [5] who found that improving the performance of windows has a substantial impact on reducing the cooling energy demand.
Furthermore, improving airtightness has a remarkable impact on reducing the heating and cooling demand, although its impact on reducing the heating demand is much greater than that on the cooling demand. It was also found that, on average, this measure reduces the heating energy demand by 47% and the cooling energy demand by 7%. These results suggest that the EnerPHit heating limit can be met in all future scenarios. These findings are in line with those found by Andreu et al. [29] who found that increased insulation and reduced infiltration have the highest impact on the total energy demand.
According to all scenarios, the introduction of night ventilation in warm and mid-seasons (no need for heating or cooling) does not affect heating since this takes place in warm and mid-seasons when the heating system is turned off. However, night ventilation has an impact on reducing cooling, but this impact decreases when climate change is significant. This may be attributed to the outside temperature increase as it will no longer be able to refresh the interior space. Despite the small reduction in energy use, it allows reaching the EnerPHit cooling energy limit under scenario RCP4.5 in 2050.
By stopping solar radiation, overhangs lead to an increase in the heating energy demand in winter and to a decrease in the cooling energy demand in summer. The overhangs do not have a significant impact on energy demand because the building under study is well oriented. Indeed, the building has three external facades oriented towards the North, East, and South, and three internal facades overlooking the playground. The internal facades are shaded with the corridor and hence only windows on the southern exterior façade require overhangs.
The installation of the MVHR system induces the most important reduction in heating and cooling energy demand. This system allows using mixed-mode ventilation; it allows opening the windows when the outside temperature is within the comfort range of 20 - 25°C and closing them when the outside temperature is not within that range. This would provide natural fresh air from outside; it saves the heating energy with the heat recovery unit and the cooling energy with the economizer. These findings are similar to those reported by Wang et al. [69] who suggested that mixed-mode ventilation is the most effective measure for reducing energy use under climate change conditions, in 2050 and 2080, for the three investigated cities. In addition, the use of the MVHR system and the mixed-mode ventilation allows for achieving the EnerPHit energy limits for heating under current conditions and for cooling energy demand under scenario RCP4.5 in 2080, and under scenario RCP8.5 in 2050 and 2080.
Furthermore, the MVHR system installation and airtightness measure were shown to be more effective in reducing the heating energy demand than the cooling energy demand. Moreover, the windows replacement measure exhibited a significant impact on reducing the cooling energy demand, while the external wall insulation measure allowed reducing both the heating and cooling energy demand.
In addition, to achieve the energy limits of the Passivhaus EnerPHit Standard, for all climate projection scenarios, it is essentially important to apply the full adaptation measures.
Most of the literature studies have discussed the Passivhaus EnerPHit Standard as a mitigation strategy. This study uses the EnerPHit Standard requirement for the adaptation of tertiary buildings to climate change.
It is worth emphasizing that the implementation of the adaptation measures seeks first to reduce the energy demand and second to improve indoor thermal comfort. Moreover, some studies in the literature showed that the addition of insulation could increase the risk of overheating [32, 70]. For instance, some authors [71, 72, 73, 74] investigated the overheating risk for Passivhaus buildings in the UK.
The present study also shows that insulation significantly decreases the heating and cooling energy demand, which suggests that insulation cannot lead to overheating; otherwise, the cooling demand would be higher.
In parallel with this, the results from other studies showed that insulation does not cause overheating in the Mediterranean zone, for future climate conditions [75, 76].
In this regard, Fosas et al. [77] revealed that the risk of overheating depends on the effects of several parameters; they also added that insulation can either decrease or increase overheating. Insulation contributes only to 5% of the total overheating response.
Nevertheless, the current study shows some limitations. It evaluated only one type of building. It is therefore highly recommended to assess other types of buildings. Moreover, this study used only two IPCC scenarios, i.e., RCP4.5 and RCP8.5, and therefore, it is suggested to investigate other scenarios.
Conclusion
This study investigates the impact of climate change on the heating and cooling energy demand in Algeria and assesses adaptation measures to meet the energy requirements of the Passivhaus EnerPHit Standard. A high school located in the municipality of Zenata in the Wilaya (Province) of Tlemcen in Algeria, which has a Mediterranean climate, was chosen as a case study and simulated in the DesignBuilder software.
In light of this, six adaptation measures were separately assessed and then combined in a gradual (stepwise) package, to adapt the building to the Passivhaus EnerPHit Standard according to two periods (2050 and 2080) and two IPCC emission scenarios (RCP4.5 and RCP8.5). The findings showed that it is possible to achieve the EnerPHit Standard in an educational building under climate change conditions. Under current conditions, the heating energy demand was largely predominant. However, as climate change occurs, the trend is reversed, and the cooling energy demand becomes predominant.
When the adaptation measures are separately assessed, they have different effects on the heating and cooling energy demand. Indeed, it was found that the heating energy demand was significantly influenced by the insulation measure for the external building envelope and airtightness.
On the other hand, the window replacement measure provides significant savings in terms of cooling energy demand in comparison with the heating energy demand. Regarding night ventilation, it was revealed that this measure has less effect on the cooling energy demand as the climate warms. Moreover, the addition of overhangs increases the heating energy demand and at the same time reduces the cooling energy demand. Indeed, stopping solar radiation diminishes the cooling energy demand in summer (warm period) but increases the heating demand in winter (cold period). Finally, the installation of an MVHR allows using the mixed-mode ventilation. This measure contributes the most to reducing the heating and cooling energy demand; it plays an essential role in achieving the EnerPHit cooling energy limit for the scenario RCP4.5 in 2080, and for the scenario RCP8.5 in 2050 and 2080.
The Passivhaus EnerPHit Standard was considered in this study. It would be more relevant to consider other energy standards in subsequent research work.
Furthermore, with the government’s perspective of supplying educational buildings with renewable energy to respond to the heating and cooling energy needs in the future, these findings would certainly be a great help for improving national standards in terms of adaptation of buildings to climate change.
