

Introduction
Research Context and Motivation
Literature Review
Scenario of urbanization in India
Review of previous works
Objectives
Materials and Methods
Study area
RESULT AND DISCUSSION
Urbanization Scenario of Bankura District
Growth Rate of Urban Population in Bankura District
Mean Population Threshold (MPT) of Facilities of Bankura District
Estimation of Functional weightage of Facilities
Estimation Centrality Score of Facilities
Estimation of Hierarchical Arrangement of Urban Centres, Bankura District, 2011
Estimation of Spatio-Functional Gap of Urban Centres, Bankura District, 2011
Planning for the Optimization of the services
Conclusion and Future Recommendations
Introduction
Urbanization is a significant social and economic phenomenon occurring rapidly across the globe [1, 2]. It correlates directly with the growth of urban areas and the rise in the percentage of the overall population migrating from rural regions [3]. Urban areas are preferred for placing administrative facilities and functions, which in turn attract people to reside in these areas [4]. It is estimated that the majority of the population of the developing world will live in urban areas; India is no exception with about 50% of the population or about 600 million people living in urban areas by 2020 [5]. Cities never grow by themselves but are placed at the centre to perform functions that are set up by the country [6]. Thus, the city is not an isolated entity but is inextricably linked with its surrounding region to act as an integrated functional area [7]. A city has two parts, a core area and a periphery area. The city acts as a core area spreading its services and products to surrounding areas. The surrounding area of a city is known as the periphery area, this area provides raw materials, and cheap labour that fuelled earlier industrial expansion and resulted in progressive urban growth [8]. Thus, an urban centre and its surrounding area are functionally interdependent. The influential zone of a region depends on what kind of amenities and facilities are available in that region. The more amenities and facilities in a region indicate the more developed city or urban centre. People from surrounding areas are attracted by these special facilities and come to urban areas to avail those benefits. The sphere of urban influence is known by different names. Several interchangeable terms for the urban sphere of influence are - Umland, Urban Field, Hinterland, Catchment Area etc. [9]. The term City Region is primarily used to describe the influence of urban areas [8].
The urban sphere of influence refers to the geographical area surrounding a city that interacts with the city through inflows and outflows [10]. In every urban centre, there is a zone of influence according to the size of population and nature of function [11]. Urban spheres of influence show the relationship between centre-to-hinterland regions, compared to the non-central regions, whereby the centre takes on more complex economic functions and provides more economic activities [12, 13]. The extent of the sphere of influence is determined by factors such as the size and range of services offered by a town and its neighboring settlements, the accessibility of transportation facilities, and the level of competition from nearby towns [1]. People are attracted to urban areas for several reasons like the availability of schools and colleges, various jobs medical facilities and other multipurpose benefits etc. [14]. Besides, people are also willing to travel to cities as urban areas provide various types of services such as trade, retail, transportation etc.
Research Context and Motivation
The uneven distribution of socio-economic facilities poses significant challenges to achieving sustainable regional development. Facilities such as healthcare, education, banking, and recreation are essential for the socio-economic advancement of a region, yet they are often concentrated in a few urban centers. This results in unequal access, creating development bottlenecks in underserved areas. For instance, in the Bankura district, Bankura town enjoys a high concentration of amenities, serving as a magnet for people and resources, while smaller towns like Simlapal struggle to meet basic infrastructural demands. This imbalance not only stifles the growth potential of smaller urban centers but also places undue pressure on larger hubs.
The selection of Bankura as a case study is driven by its unique socio-economic and geographical context. As a predominantly rural district with emerging urban centers, Bankura exemplifies the challenges of uneven development in developing economies. The district's urban hierarchy, defined by the spatial arrangement of facilities, reflects broader patterns of inequality that are prevalent in similar regions. By examining these patterns, this study seeks to uncover insights that can inform urban planning strategies, not only for Bankura but also for other regions facing analogous challenges.
The rest of the article is organized as below: section 2 discusses the literature survey, Further, section 3 and 4 present the scenario of urbanization in India, and materials and methods, respectively. Then results and discussion are presented in section 5. Finally, section 6 come up with the conclusion and future recommendations.
Literature Review
A growing body of research underscores the importance of equitable urban infrastructure for sustainable development. Studies have shown that uneven facility distribution hinders socio-economic growth, exacerbates regional inequalities, and impedes sustainable development goals (SDGs). For instance, Sharma et al. (2022) emphasized the role of balanced urban planning in mitigating regional disparities, while Gupta and Kumar (2021) highlighted the impact of infrastructural inequality on migration and economic growth in Indian districts. However, there is a paucity of research focusing on the specific dynamics of urban facility distribution in semi- urban and rural contexts like Bankura.
Existing studies on urban infrastructure in West Bengal have largely focused on metropolitan regions, leaving smaller districts underexplored. This study seeks to fill this gap by providing an in-depth analysis of urban centers in the Bankura district. It builds on the methodologies employed in previous research while offering novel insights into the hierarchical development of urban centers. Furthermore, the study incorporates recent advancements in statistical techniques to assess facility distribution, adding rigor and relevance to the analysis.
By situating the research within the broader literature on urban planning and regional development, this study not only addresses the specific challenges of the Bankura district but also contributes to the global discourse on achieving equitable and sustainable urban growth.
Scenario of urbanization in India
Currently, a majority of the global population resides in urban areas to avail themselves of various amenities. Urbanization stands out as the most significant phenomenon of the 20th century, profoundly impacting all aspects of national life in India. Besides, the second most populous country in the world after China, India’s increasing urbanization has a regional as well as global implications [15]. After independence, urbanization in India began to accelerate due to the country’s adaptation toa mixed economy, which leads to the development of several private sectors. According to the World Bank collection of development indicators, India’s urban population in 2021 was reported to be 35.39%. In 2021, about one third of India’s total population living in cities. The trend shows that urbanization has increased by about 4% over the past decade, meaning people are moving away from rural areas for work, basic facilities, as well as urban life [16]. By 2050, urban India is projected to host fourteen percent of the global urban population. Within the next three decades, approximately half of India's population will transition to urban living, leading to significant transformations in landscape, economic structure, and social dynamics [17].
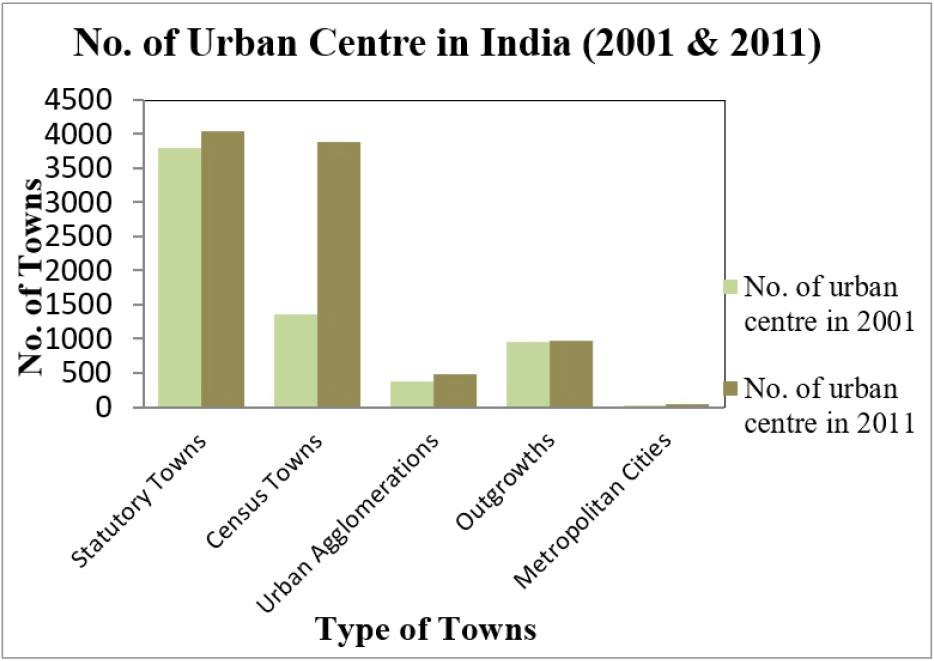
The total population increased from 238.4 million in 1901 to 1210.19 million in 2011 while the population living in urban areas increased from 25.85 million in 1901 to 377.11 million in 2011 (GoI, 2011; Table 1; Figure 1). The number of urban agglomerations/towns increased from 1827 in 1901 to 5161 in 2001 [1]. The number of statutory towns in India is 3799 as per 2001 census which has increased to 4041 in 2011 (Table 2 & Figure 2). At the same time, the number of urban agglomerations is 474 and the number of metropolitan cities is 52 (Census of India, 2011). The size of country’s urban population has increased from 10.83% in 1901 to 31.16% in 2011 [18]. Figure 1 illustrates the evolving trend of urbanization in India, depicting a gradual increase that signifies India's advancing stage in the process of urbanization
Table 1.
Trend of Urbanization in India (1901-2011)
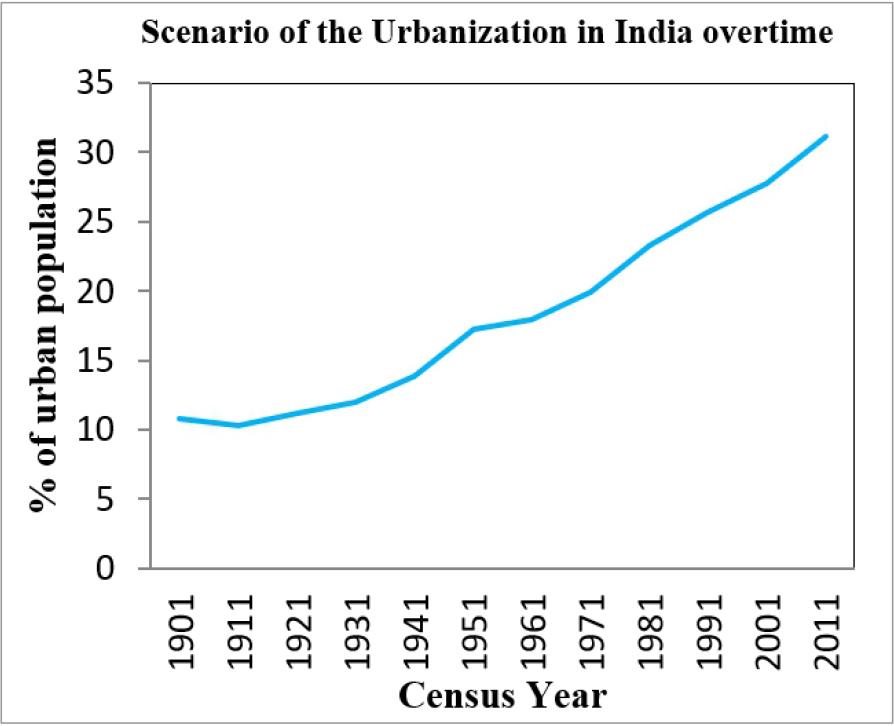
Table 2.
Number of Urban Centres in India (2001 and 2011)
| Type of Towns | 2001 | 2011 | Addition |
| Statutory Towns | 3799 | 4041 | 242 |
| Census Towns | 1362 | 3892 | 2530 |
| Urban Agglomerations | 384 | 474 | 90 |
| Outgrowths | 962 | 981 | 19 |
| Metropolitan Cities | 35 | 52 | 17 |
Urbanisation patterns at the regional level are very diverse in India. In 2011, there were 18 states and union territories, where the level of urbanisation was higher than the national average. Delhi and Chandigarh are at the highest level of urbanisation where about 97% population lives in urban areas. Goa, Tamil Nadu, Kerala, Maharashtra, Gujarat, Karnataka and Punjab were at the stage of the high level of urbanization, with urbanization rate recorded as 60-80% (Table 3), and these are mainly developed states. However, Himachal Pradesh, Bihar, Assam, Odisha and Uttar Pradesh recorded urbanization levels of less than 20%. Among the states/union territories which are economically developed have a higher level of urbanization. On the other hand, low level of urbanization is observed in those states/UTs which are economically underdeveloped [19]. Dualism is the main characteristic of India’s urbanization since its Independence. Historically, it can be said that further urbanization occurred due to industrial, infrastructure, services and investment opportunities in the urban centres of the developed states of India.
Urbanisation patterns at the regional level are very diverse in India. In 2011, there were 18 states and union territories, where the level of urbanisation was higher than the national average. Delhi and Chandigarh are at the highest level of urbanisation where about 97% population lives in urban areas. Goa, Tamil Nadu, Kerala, Maharashtra, Gujarat, Karnataka and Punjab were at the stage of the high level of urbanization, with urbanization rate recorded as 60-80% (Table 3), and these are mainly developed states. However, Himachal Pradesh, Bihar, Assam, Odisha and Uttar Pradesh recorded urbanization levels of less than 20%. Among the states/union territories which are economically developed have a higher level of urbanization. On the other hand, low level of urbanization is observed in those states/ UTs which are economically underdeveloped [19]. Dualism is the main characteristic of India’s urbanization since its Independence.
Table 3.
Regional pattern of urbanization in India, 2011
Historically, it can be said that further urbanization occurred due to industrial, infrastructure, services and investment opportunities in the urban centres of the developed states of India.
Review of previous works
Prakash Rao (1938) – Prakash Rao attempted to define the influence zone of Mysore city using a basic mathematical model. He calculated the radius of this zone based on the population size of Mysore state. Prakash Rao also categorized the influence around cities in Mysore state into three grades: 1. Areas with minimal influence, 2. Areas with significant influence, and 3. Intermediate areas. However, his approach was primarily theoretical, assuming the city's sphere of influence to be circular and determining its radius through statistical calculations.
A.E. Smailes (1947) – The study focused on accurately defining the urban sphere of influence, using specific indicators such as education, healthcare, recreation, newspaper circulation, and milk supply zones. It identified gradient pattern that diminishes with distance from the city. A.E. Smaile proposed that every urban region can be categorized into three zones: 1. Core area, 2. Outer area, and 3. Fringe area.
[20] worked on “The Hierarchy of Central Functions within the city”, he stated that - The study presents a qualitative aspect of finding the central function of Zurich city, Switzerland. It has been found that the difference in demand for central services leads to the formation of a hierarchy of central places, which are the locations of a group of central functions. It further brought out that the density of the population of the town is a factor of the size of influence densely is less.
S.M. Alam (1965) defines ‘A City’s Hinterland as an area socially, economically and culturally linked with it. The area over which it extends its influence is called the sphere of urban influence.
[21] made significant contributions using a model called “Sphere of Urban Influence and Urban System” to depict the urban sphere of influence in the United States of America, Ireland and Ghana. Nowadays, with the high level of economic and social development in western countries, as most developed countries enter post-industrial societies, node-to-node interactions are observed more than node-to-hinterland relationships, as a result, the study of the urban sphere of influence is generally declining. But, node-to-hinterland linkages are also influential as are still industrializing.
B.J.L Berry and R.F. Lamb (1974)–attempted to evaluate the interaction model as a basis for measuring the urban sphere of influence in the United States based on newspaper market circulation, and the interaction model is used as a basis for describing planning regions.
[12] stated that the concept of urbanization was developed by British policy, i.e. during the British period; the tea plantation of Assam and the plantation in Africa were the destinations of labourers from Bihar, Uttar Pradesh and Orissa. In the pre-independence period, a large influx of refugees from Eastern Bengal led to Kolkata and a large number of people are concentrated around Asansol.
According to Carter (1995), every urban centre possesses a sphere of influence, regardless of population size or the type of activities conducted there. The identification and delineation of these spheres rely on the premise that individuals will travel to the nearest location where goods or services are readily accessible.
According To Verma (2006), ‘each city forms the core of a larger area and the dominant area is the city's Sphere of Influence’. The area around each city that comes under its economic social and political influence is known as the sphere of influence.
[11] worked on the Sphere of Urban Influence, he stated that - an urban centre develops and grows through interaction with surrounding areas to form a functional region. A town acts as a core area spreading its services and goods to the surrounding area, which acts as the periphery. Instead, the periphery provided raw materials and cheap labour that fueled earlier industrial expansion and resulted in progressive urban growth.
[22]–worked on the delineation of the sphere of influence of towns of Aligarh District based on the total centrality score of facilities of towns which is the sum of all services and goods it provides to surrounding areas. They also said urbanization and regional development are closely related to each other. Towns with high centrality scores reveal a larger sphere of influence and become a centre of growth than those with low centrality scores (Ali and Varshney 2012).
[23] investigated the urban sphere of influence zones by using the gravity model in all cities in China with the objective years of 1990, 2000, and 2009. This study utilized an optimized gravity model incorporating detailed temporal and distance factors to analyse the spatial distribution of China's urban sphere of influence and the spatial attributes of urban agglomeration.
[22] studied the urban zone of influences over the three towns of Tamluk, Contai, and Midnapur using the functional importance formula.
[24] investigated the factors of the urban sphere of influence in some metropolitan cities in China and applied the principal component analysis to illustrate the concentrated power of the city. This was achieved using breakpoint theory and a weighted Voronoi diagram that was able to identify the influential zone of the central city.
[25] analyzed the distribution of urban infrastructure in metropolitan areas, focusing on the impact of urbanization on facilities like healthcare, education, and transport. The study uses geospatial techniques to map the availability of amenities across cities and suggests that uneven growth leads to socio-economic disparities. The study's reliance on geospatial data and the focus on metropolitan cities contrasts with the present research, which uses secondary census data to assess facilities across smaller urban centers like Bankura. The current study incorporates statistical methods to analyze the uneven distribution, offering a more granular and localized understanding.
[26] explore the integration of sustainable urban planning models with a focus on waste management and green infrastructure in urban areas. Their approach uses advanced AI-driven modeling and optimization algorithms to predict future urban facility needs. In contrast, the present study focuses on a more traditional, statistical approach, relying on the Census of India 2011 and conventional techniques for evaluating the adequacy of urban services in a specific region. The gap here lies in the technological approach—while Gupta and Singh use cutting-edge AI for predictive modeling, this research remains grounded in existing statistical analyses to understand facility distribution.
[27] investigate the hierarchical growth of cities in India, specifically focusing on the relationship between urban center hierarchy and the distribution of basic amenities. Their study uses a multi-criteria decision analysis (MCDA) method to evaluate urban growth patterns. The present research differs by analyzing the socio-economic infrastructure through statistical techniques rather than MCDA, thereby providing a comparative advantage in terms of regional planning recommendations based on historical data.
[28] focus on optimizing rural-urban infrastructure linkages in West Bengal, emphasizing the distribution of public amenities like healthcare, education, and transportation. Their study primarily focuses on the rural- urban interface, proposing strategies for better connectivity. The key difference with the present research is that while the previous study emphasizes rural-urban linkages, this research specifically analyzes urban centers within Bankura district, with a detailed focus on the uneven distribution of amenities and recommendations for urban planning.
[29] explore the challenges faced by tier 2 cities in India, including issues like social infrastructure, employment facilities, and educational opportunities. They use a survey-based approach to understand local perceptions of facility availability and adequacy. While their research provides valuable qualitative insights, the present study uses secondary data from the Census of India 2011 and focuses more on statistical modeling to assess urban facility distribution. This creates a methodological distinction, where the current research seeks to quantify the availability of amenities across urban centers.
Objectives
The objectives of the present research work are as follows;
•Assessing the urbanization scenario of Bankura District.
•Delineating the zone of influence of urban centres of Bankura District in relation to the different services.
•Making a hierarchical arrangement of urban centres of the study area.
•Estimating the spatio-functional gap of various kinds of facilities in urban centres of Bankura District.
•Providing planning recommendations to optimize the level of services by the urban centres.
Materials and Methods
The present study is based on a secondary source of data acquired from different sources. Basically, population related data have been acquired from Census of India and others government organization. District Census Handbook 2011, Town Directory 2011 etc. for the study area have been acquired from the official website of Registrar General of Census, India. Besides, different government reports, published articles, thesis also been considered for the present work.
The collected data have been analyzed using different advanced statistical techniques for the identification and generalization of the actual scenario. To generate city raking based on functional importance, a certain weightage needs to be assigned to all the facilities under study. The details of selected statistical methods which have been deployed in this work are discussed below;
1.To analyze the urban population growth rate following method was used----
Urban Population Growth Rate = (P1 – P2)/P2*10
Where,
P1= population of the current year
P2 = population of the previous year
2.The following methods were adopted to identify the zone of influence –
a.The Mean population threshold of all the facilities was estimated as the population-function ratio that can be expressed as:
mT=P/Nf
Where, mT = mean Population threshold
P =total population,
Nf = total number of facilities
b.The functional weightage of the facility is estimated with the following equation:
Wfi=mTi/mT1
Where, Wfi- estimated weightage of function I,
mTi-mean population threshold of ith function
mT1- lowest mean threshold population
c.centrality score or Functional importance of urban centre was estimated with the equation:
CI = ∑ (Fui ×Whi)
Where, CI =centrality index or functional importance of a town
Fui = No. of functional units of function
Whi = weightage of function
d.V.L.S. PRAKASH & RAO’S METHOD: The degree of influence of each central place is estimated by its centrality score. This method was used to present a modification for the calculation of the radius of functional influence of each city in a particular region.
Complementary regions of central places were demarcated using the mathematical equation as follows:
S.I = TCA/C Where,
S.I = sphere of influence
R = √TCA/CTC = Total centrality score of central places
A = Total area (sq. km) of the study area
C = Total centrality score of all central places
R = Radius of indicating the sphere of influence (in km)
3.The spatio-functional gap was computed with the equation as follows:
Rij = (P÷Pi)/ (F÷Fi)
Where,
Rij= relative level of function between urban centres (the zone of influence of each urban centre and all zones of urban influence)
P = total population of all urban centres (population of zones of urban influence of urban centre)
Pi = population of ith urban centre (or zone of influence of ith urban centre)
F= sum of functional importance or centrality score of the concerned facility of all urban centres
Fi= Functional importance or centrality score of the concerned facility of ith urban centre (or of the zone of influence of ith urban centre).
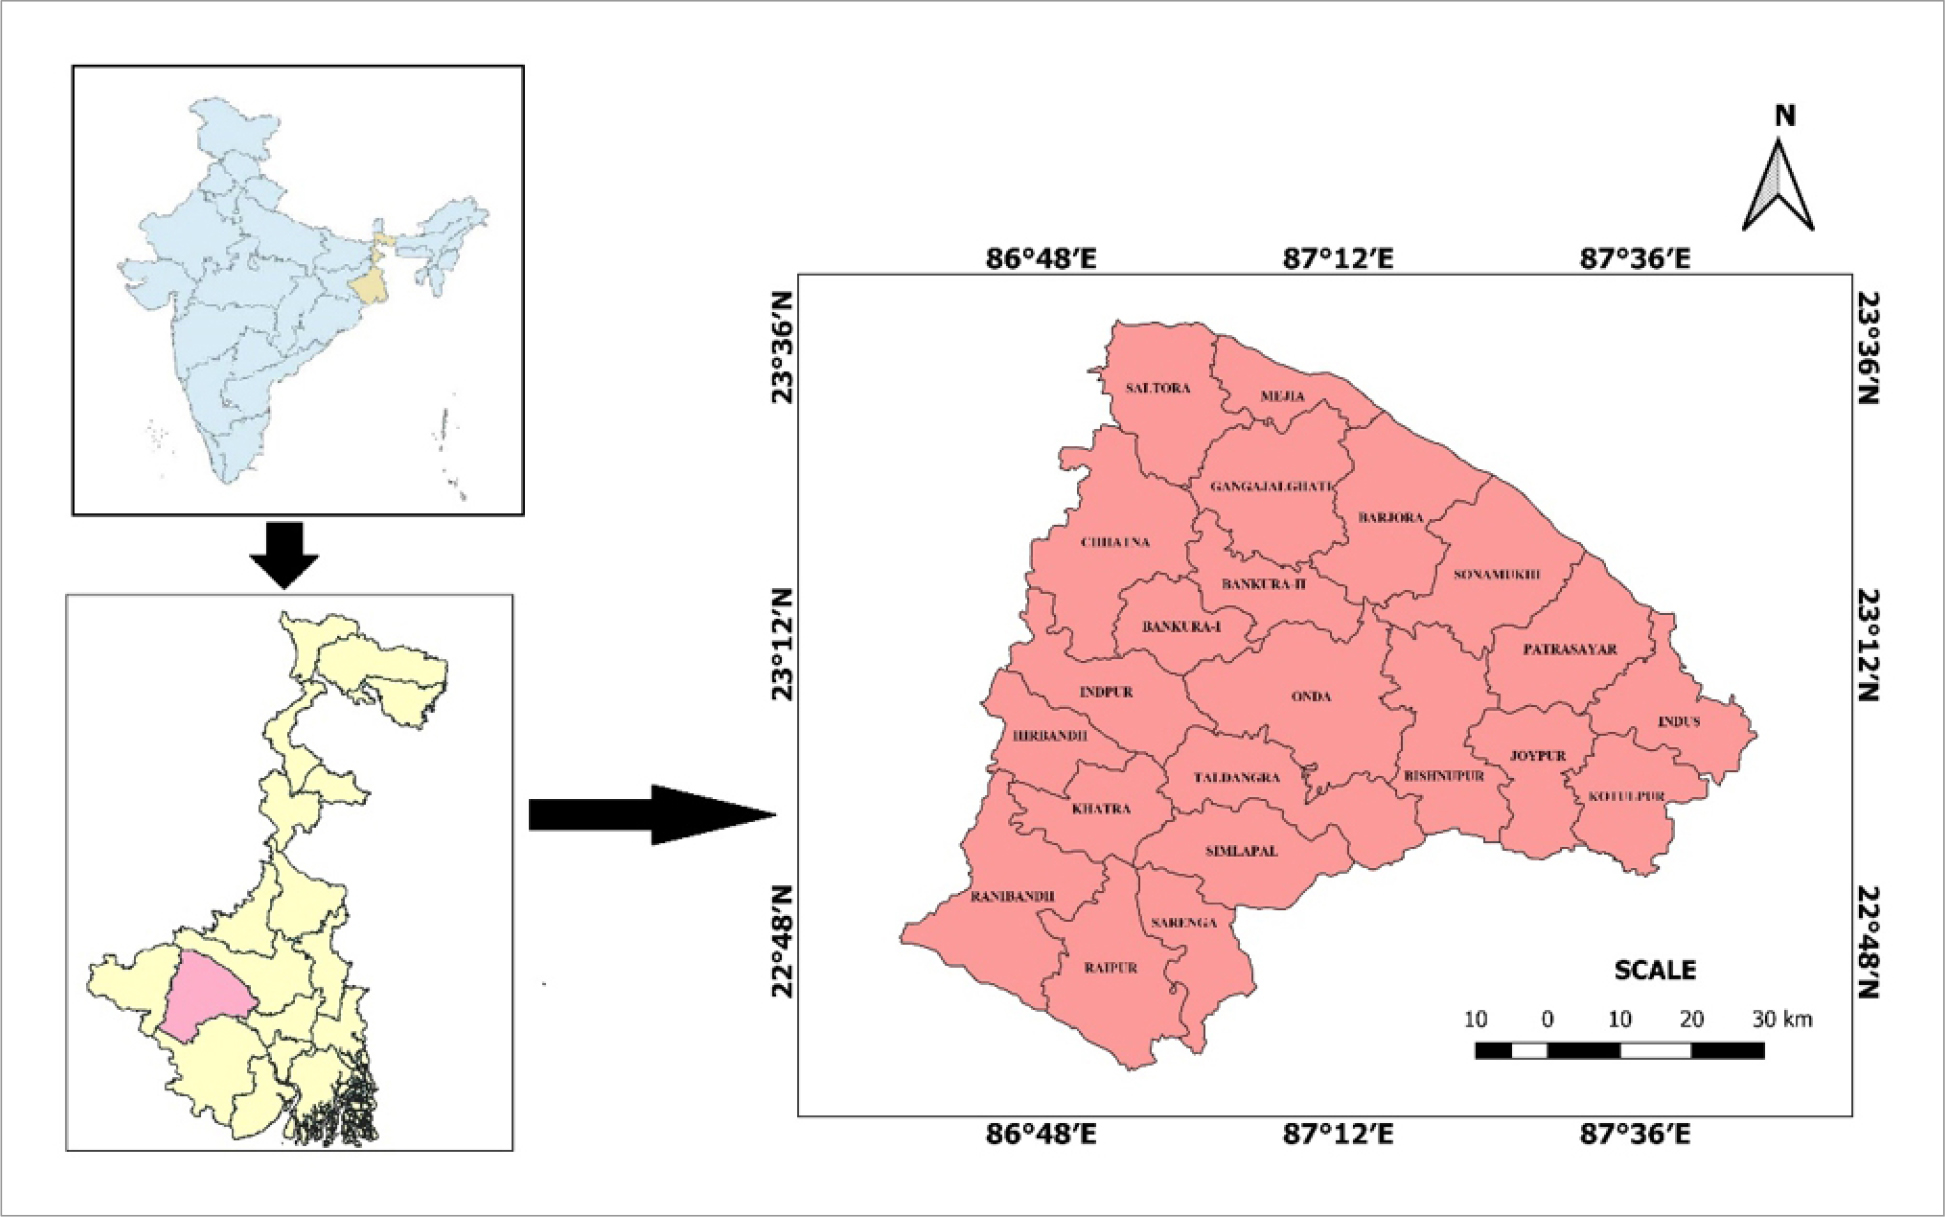
Study area
Bankura district is surrounded by the Hooghly district in the east, Purulia in the west, Burdwan in the north and Midnapore in the south of West Bengal state (GoI, 2011). River Damodar separates Bankura from the Burdwan district in the northern part (GoI, 2011). It is somewhat triangular and lies within 23°38ʹ to 22° 38ʹN latitude and 86°36ʹ to 87°46ʹE longitude (Figure 3). The district is generally characterized by undulating topography and the presence of lateritic soil with low fertility; however, the eastern and southern part of the district is more productive than the western part (GoI, 2011). The quality of the soil of the uplands is poor; on the other hand, the lowlands have fertile soil. Bankura district is one of the most underdeveloped districts of the state of West Bengal with levels of low industrialization and high enslavement of agriculture (GoI, 2011). The growth rate of small-scale industries is also not evenly distributed over the region. The small-scale industries are mainly based on the processing of local resources. However, the district is moderately rich in the fields of handloom and handicraft. The district has been placed in category ‘C’ as per the incentive scheme of the State Government (GoI, 2011).
RESULT AND DISCUSSION
Urbanization Scenario of Bankura District
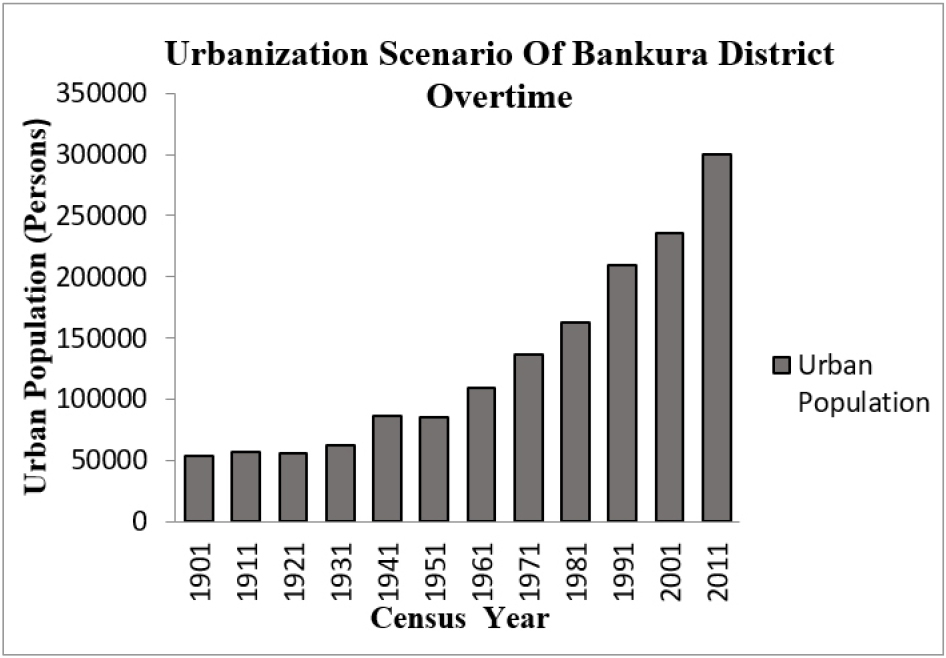
The process of converting rural area into urban is called urbanization. In demographic terms, urbanization denotes the shift of population from rural to urban areas over a period of time. [25]. Urbanization depends on the socioeconomic system and the rate of development of society. According to 2011 census, 8.33% of the total population of Bankura lives in urban areas. The total urban population in Bankura district is 299773 in 2011 which was 235248 in 2001 (GoI, 2011; GoI, 2001).
Looking at the historical context of the district, it is noted that in 1901, the urban population was just 53,275, with only three municipalities existing in Bankura district: Bankura Municipality, Bishnupur Municipality, and Sonamukhi Municipality.
After that Bankura recorded an urban population of 57206 in 1911, but in 1921 urban population declined and it reached 55454 due to the haphazard spread of cholera and malaria, and the lack of proper health care facilities in the district (GoI, 1961; Table 4; Figure 4). After 1931 the urban population recorded a positive growth which was recorded 62388 and 108818 in 1931 and 1961 respectively (Table 4; Figure 4). In 1991the urban population of Bankura District was 209943. As per census 2001, Bankura recorded a total 5 urban centres out of which three were Municipal areas and two census towns respectively (GoI, 2001). Currently, Bankura district has a total of 12 urban centres where seven new census towns have been added in 2011 (GoI, 2011).
Table 4.
Urban population of Bankura District over time
Growth Rate of Urban Population in Bankura District
Population growth can be simply defined as the change in population size between two periods of time. When the change is calculated in percentage it is called the “Growth Rate of Population” [26] Growth may be positive or negative. Positive growth may arise in such a situation when the total population of the current year is more than the previous year. The negative growth rate may be accounted for when the population of the current year is recounted to be lesser than the previous year.
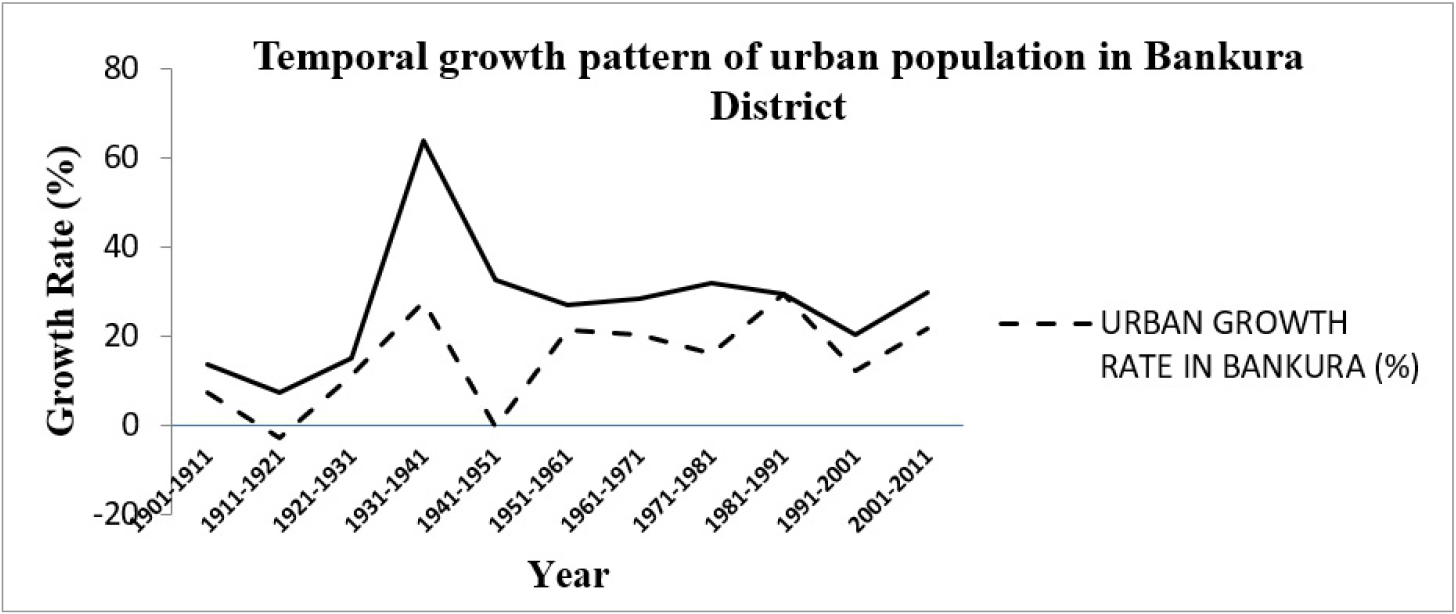
Here an attempt has been made to show the growth rate of the urban population of Bankura district from 1901 to 2011. In 1901 the urban population was recorded as 53275 persons. Table 5 depicts the negative population growth rate of the district in the two-census year e.g. 1921 and 1951 in the district (Table 5; Figure 5). In 1921 the main reason for negative population growth was due to epidemics of influenza, plague, smallpox, cholera etc. [26]. The growth rate of the urban population in West Bengal during the said period was 7.16% (Table 5 and Figure 5). This negative growth rate recorded in the 1951 may be correlated with the partition of the country specially; many Muslims from West Bengal migrated to Bangladesh [27, 28]. In 2001 the urban population growth rate in Bankura was recorded 12.05% and in 2011 which reached to 21.52%, this remarkable growth can be justified with the emergence of seven new census towns in Bankura District (GoI, 2011).
Table 5 shows the urban population growth rate of Bankura district which witness a continuously increasing od urban population except few exceptions. The highest growth rate is found in 1981-1991 and the lowest negative growth rate is found in 1911-1921 & 1941-1951.
Table 5.
The temporal growth rate of the urban population in Bankura District, 1901-2011
Mean Population Threshold (MPT) of Facilities of Bankura District
The threshold population is the minimum population required to sustain any services [1]. Alternatively, the threshold population is defined as the population size necessary to support a specific function. It is the basis for determining the functional importance of each city. The threshold population refers to the minimum population size needed to sustain a specific function.
Mean Population Threshold of each facility or service is not equal; they differ from each other according to importance or order function. Higher values of threshold indicate higher-order function and lower values of threshold indicate lower-order function [7]. Table 6 exhibits 17 services (provided by all urban centres of Bankura District) with their particular threshold size. The significance of any function can be assessed by its population threshold (Christaller). A higher population threshold increases the value of the function. So, college is more important than primary school. Table 6 exhibits that for the primary school the mean population threshold value is 1381 for sustaining this particular kind of service.
For higher secondary schools the mean population threshold value is 9084 people and the facilities like allopathic hospitals required 42825 people, and 49962 people are required for college facility sustaining. Under health care services, there are various kinds of facilities like Allopathic hospitals, BPHC, RH, family welfare centres, dispensaries etc. In case of banking services, there are different types of facilities like Banks, Agricultural Credit Society, and Non-Agricultural Credit Society etc., the threshold population for these facilities are 6378, 149887&7494 persons respectively. For public library facilities, the threshold population value is 24981. The details statistics are given in Table 6.
Table 6.
Mean population Threshold Value for 17 facilities in Bankura District
Estimation of Functional weightage of Facilities
The functional significance of a settlement relies on the availability of sufficient facilities. Not all settlements in a region may possess all the necessary facilities to fulfill social functions collectively [13]. In integrated area planning, population centers are strategically planned at the lower levels of the hierarchy to promote balanced growth and regional development of an area [29]. The weightage value of facilities indicates relative importance of a town [30, 31]. The weightage of facilities has been computed by dividing its population thresholds by the lowest mean population thresholds for each town [32]. In the case of the lowest population threshold, the weightage value is taken as 1 and the weightage value of the rest of the facilities is calculated based on it. Therefore, higher mean population thresholds indicate greater importance, while lower thresholds signify lesser importance. Consequently, services appearing more frequently are considered less important, whereas those appearing less frequently hold higher importance [7].
Here, Table 7 exhibits that the lowest mean population threshold value is 1381, and its functional weightage value is 1, the weightage value of the higher secondary school is 6.58 and 36.18 for the weightage value of college. For the allopathic hospital & BPHC, the weightage values are 31.01 and 72.36 respectively the highest weightage value is agricultural credit society and stadium and the lowest functional weightage value is primary school facilities. Details of statistics are given in Table 7.
Table 7.
Estimation of the functional importance of Each Urban facility in Bankura District, 2011
Estimation Centrality Score of Facilities
Centrality is the composite functional importance of all types of facilities available in a particular urban centre [28]. Centrality is the number of central functions necessary to serve external service areas [20]. Centrality value incorporates the aggregate amount of services that a central place provides to its hinterland [22]. It is a relative term to define or explain the comparative functional difference of all towns under study. It is significant to arrange the towns hierarchically. The functional importance of towns is estimated before analysing the city centrality scores. In simpler terms, the centrality score is the total weighted value of facilities available across all urban centres within a region. It is an important way to estimate the future potential for the expansion of an urban centre [33, 34, 35]. The current analysis presents the distribution of 12 urban centers in Bankura district, including their population size and composite functional score within each size category.
The above Table 8 and Figure (Figure 5) revealed that the urban centre named Bankura stands at the highest position with functional importance of 986.15, the total population is 137386 and the total area is 19.06 sq. km and has all socio-economic facilities. The functional importance of Bishnupur Municipality area is 674.60; Sonamukhi has functional importance of 574.57, Barjora with functional importance of 239.58, Beliatore with functional importance of 164.68, Simlapal with functional importance of 260.84, which can be seen from above table. Raipur Bazar stands at the lowest position with a functional importance of only 87.87 with a population of 6280 and an area of 2.42 sq. km respectively. Therefore, there is a noticeable variation in functional significance among the towns in the study area.
Table 8.
Estimation of centrality score of the different urban centres of Bankura District, 2011
Estimation of Hierarchical Arrangement of Urban Centres, Bankura District, 2011
Urban hierarchy is determined by ranking cities according to the population size within each urban area [29]. Table 9 displays the hierarchical arrangement of urban centers, categorized from first-order to fourth- order towns. Bankura urban center is the sole city classified under the first order of functional hierarchy. Only Bishnupur is identified within the second-order hierarchy, with functional importance scores ranging from 614.4 to 921.59. Sonamukhi, with functional scores between 307.20 and 614.39, is categorized in the third order. The remaining nine towns—Jhanti Pahari, Ghutgarya, Barjora, Beliatore, Kotulpur, Simlapal, Ledisol, Khatra, and Raipur Bazar—have functional scores below 307.20 and are classified as fourth-order or lowest-order towns in the functional hierarchy of Bankura District. The hierarchical arrangement indicates that higher order town provides all kind of required amenities and facilities whereas, lower order town indicates that there has almost lack of some amenities and facilities. The study of hierarchy is useful for planning because it reveals functional and spatial gaps in the economy (Siddhartha and Mukherjee, 2021).
Table 9.
Hierarchy of Urban Centres, Bankura District
Source: Calculated by the author based on Table 8
The urban sphere of influence is the surrounding area from which individuals travel to the city to access specific goods and services. The distance people are willing to travel varies, depending on the importance of the goods or services they need [7]. If the goods or services are of a convenient type (easily accessible and purchased with minimal effort), people will travel the shortest distance necessary to acquire them. Convertsely, for comparative services, individuals are willing to travel further distances. Thus, both the type of goods and the travel distance are significant and positively correlated. A town offering a wide range of higher- order services attracts visitors from far and wide.
The Figure 6 shows Hierarchical order of Urban Centers in Bankura District. Table 10 shows that Bankura town spread its influence up to 42.91 km covering an area of 1841.03 sq. km which is the highest radius of influence area. It is followed by Bishnupur town with a radius of 35.49 km and sphere of influence of 1259.40 sq. km. Sonamukhi is in the third position with a radius of influence area of 32.75 km (Figure 6). The radius of influence area of Simlapal town is 22.07 km. Raipur Bazar is the bottom position with a radius of influence of 12.81 km sphere of influence is 164.04 sq. km.
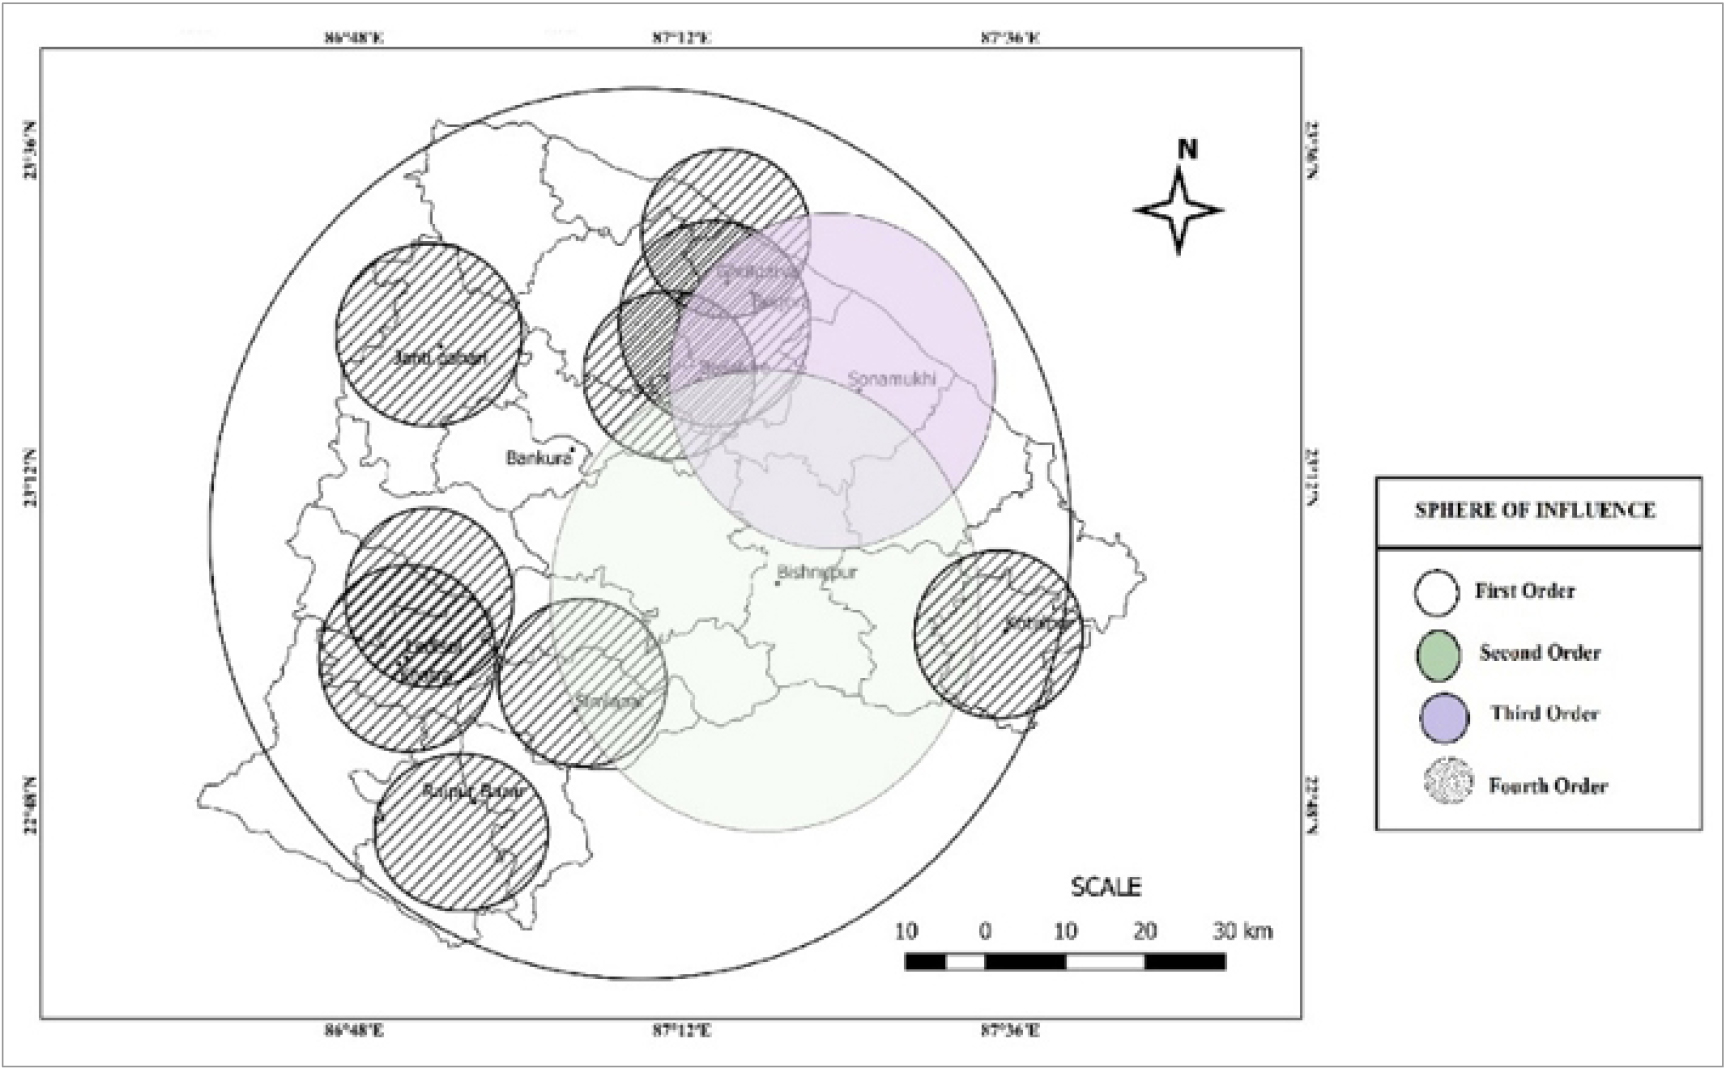
Table 10.
Delineation of zone of Influence based on V.L.S Prakash Rao’s modified method
Estimation of Spatio-Functional Gap of Urban Centres, Bankura District, 2011
Socio-economic amenities and facilities are not evenly distributed across all settlements within a region. Consequently, some settlements have sufficient facilities, while others lack adequate services. The adequacy or inadequacy of these facilities is due to the unplanned distribution of resources among different settlements [30, 36, 37, 38, 39, 40, 41, 42, 43, 44, 45, 46]. The unequal distribution of socio-economic benefits is mainly understood through functional gap analysis. It helps assess the need for additional facilities within a region and achieve balanced regional development.
The spatio-functional gap is the ratio of the population of a particular urban centre to the population of all urban centres divided by the ratio of the composite functional importance of the particular urban centre to the composite functional importance of all urban centres. The relative ratio has been considered in the estimation of the balance between populations and existing facilities in urban centres. The range of the ratio above or below 1.0 signifies sufficient or insufficient facilities for the population [12]. Through this relative ratio, it can be observed how many urban centres are inadequate for serving facilities to the population and how many urban centres have the functional potential to appeal to more migrants alongside a higher probability of further growth.
Table 11 exhibits that in Bankura town, inadequacy of different kinds of facilities like educational facilities such as secondary school, higher secondary school, and college with their Rij (relative level of function between urban centres) value are 0.44, 0.79, and 0.73 respectively. Inadequacy of health care facilities like Allopathic hospitals, and family welfare centre are also observed in this urban centre. The Rij (relative level of function between urban centres) value for Allopathic hospital and family welfare centre are 0.31, and 0.54 respectively. In this town, we can see the inadequacy of the bank’s cinema hall, auditorium etc. In other urban centres Sonamukhi, Bishnupur, Jhanti Pahari has inadequate of educational, healthcare & recreational facilities. In Simlapal census town, there has some inadequacy of primary school, college, allopathic hospital, dispensary, banks, and also recreational facilities like cinema hall stadium etc. The details of the statistical calculation are given in Table 11.
Table 11.
Estimation of Spatio-Functional Gap of Bankura Towns, 2011
Planning for the Optimization of the services
Planning optimization is used for long-term master plans. It is specifically designed for very fast calculations involving a large amount of data [12, 46, 47, 48, 49, 50, 51, 52, 53, 54, 55]. Multiple instances can work together to compute the plan since it is built as a hyper-scalable multitenant service. Through proper planning, the problems of any region can be solved properly, which can assure the sustainable development of that particular region. For proper development of an urban centre, few basic principles must be followed. Such as;
1.Urban growth needs to be strong along with the development of the economic structure of an area.
2.The population of an urban centre must be balanced with the facilities available within that urban centre.
3.The distribution and location of facilities should be such that the people of the city and its surrounding areas can easily access them.
4.To maintain a better quality of life among the residents of urban centres, every urban centre should allocate higher and lower-order amenities and facilities.
5.One of the significant planning approaches is to connect the entire urban centre with an efficient transportation facility; therefore, they can be well connected to higher-order urban centres.
From the above discussion, it is derived that, different urban centre of Bankura district witness different dimension of problems. There is no single planning tool which can act as panacea to solve these problems. Multi-dimensional comprehensive approaches can act as the crucial planning tool to address these problems. Different urban centre of Bankura district faced sufficient facilities-related problems. Where some region adequately serviced, few places remain out of the facility. Basically, few facilities are not adequately served among all the urban units. From Table 11, it can be seen that, there exist the spatio-function gap of 4 kinds of facilities. Analysis of Table 11 also derived that there are additional needs for different higher and lower-order facilities in these urban centres. Here, an attempt has been taken to formulate plan for the study region to assure the future optimum development. The recommended plans are as follows;
1.Establishment of new Educational Institutions: For the betterment of educational facilities in Bankura town, there is a need to introduce 07 new secondary schools, 03 higher secondary schools and 01 college in the district. Simlapal town of Bankura district is one of growing towns, where rural people basically migrated to assure the future of their child through proper education, which increases the demands to introduce 01 new primary school and 01 college. Besides, the mathematical calculation demands to open another 05 primary school in Barjora census town and 01 primary school in Kotulpur. In the same times, in the present study, Table 12 may be taken as self-explanatory approach to study the need to introduce new educational facilities in the district.
Table 12.
Estimated number of new unit(s) in towns for balanced or near-to-balance distribution of facilities
Source: Calculated by the author from table 11 based on Town Directory, 2011
2.Establishment of new Hospitals & Nursing homes: There is a saying in all over the world “Health is Wealth”. Everyone desires to assure good health in any cost. The mathematical approaches in this study derives that there no sufficient health care facilities among the different urban places of Bankura district. In the study region, for a better and optimum healthcare facilities there have an additional need to initiate for hospitals, nursing homes, and dispensaries. The analysis depicts that, in Bankura town, there is an immediate need to introduce another 02 allopathic hospitals within the area in association with establishment of 03 nursing homes, and 06 dispensaries. Whereas, in Simlapal town, there are emergency need to introduce another 01 allopathic hospital, 01 nursing home and 01 dispensary to assure the proper health care facilities in the town. The study also recommends for the establishment of 01 nursing home and 01 family welfare centre in Barjora census town.
3.Establishment of new banks, ATM counters & CSP centres: Recently Digital India turned in a buzz word, which sought for the digital media of banking among the common people of the country. The study region witnesses a very insufficient banking facility. To conquer the banking facilities problems, government must introduce a new banking facility in Bankura and Simlapal urban area. Another remedial measure to arrest the banking facility related problem is to rearrange the branch of banks, ATM counters and Customer Service Points in association with incorporating new ATMs for these towns. The mathematical approach for study sought for the introduction of 06 new branches of banks in Bankura town and 01 agricultural credit society for Simlapal town.
4.Establishment of a new recreational centre: Recreation facilities in different form play a very effective for the optimum development of an urban area. To assure the good health of urban dwellers especially child and old age people, availability of recreation facility is basic requirement. Therefore, for the proper development of these urban centres, there is additional need to introduce recreational facilities. In Bankura town, there are various kinds of recreational facilities like – a public library, cinema hall, auditorium, and Stadium. But these facilities are not enough for the people of this town and additionally 04 public libraries, 01 cinema hall, and 03auditoriums are urgently need to establish. In Simlapal town there isa need to introduce 01 stadium, and 01 cinema hall for betterment of recreation facilities.
5.Others
•To ensure a high quality of life for residents, urban centers should be equipped with a range of both higher and lower-order facilities.
•The most significant planning approach is to connect all the urban centres of the Bankura district with an efficient accessible transportation facility; so that they can be well connected to higher-order urban centres for availing any kind of urban amenities and facilities.
Conclusion and Future Recommendations
In the present research it has been tried to comprehend the hierarchical arrangement of the different urban centres of the Bankura District. In the district, Bankura is the largest town, it is the first-order urban centre, and its zone of influence is much higher than any other urban centre of the entire the district. The distribution of the population and facilities mutually enhances each other, with both being heavily concentrated in major urban areas. These centers, which possess a significant number of facilities and high functional importance, exert a pull effect that draws more people from the surrounding regions. As a result, they become hubs with further growth potential by offering accommodation. As Bankura is the big town in Bankura District has every facility available in terms of health care, education, banking, recreation & working facilities as compared to other towns especially Simlapal. The sphere of urban influence of Simlapal town is much smaller as this is the less developed urban centre, and socio-economic amenities and facilities are not eventually distributed in that urban place. These two urban centres have some higher and lower-order facilities- related problems. Some facilities are recommended for the proper development of those areas. So, different types of planning as proposed should be undertaken for the improvement and optimization of the services.
Limitations of the Study: While the study provides valuable insights into the urban infrastructure and planning status of Bankura district, it has some limitations. The research relies solely on secondary data from the Census of India 2011, which may not reflect the most current socio-economic developments and infrastructure conditions. Additionally, the study does not explore the impact of rapid urbanization and migration patterns since the 2011 Census, which could significantly alter the distribution of facilities. The focus is also restricted to urban centers within Bankura district, excluding rural-urban interactions at a broader regional level.
1.Equitable Distribution of Resources: Policies should be formulated to ensure a more balanced allocation of socio-economic facilities across urban centers. Priority should be given to underserved areas like Simlapal to reduce disparities and promote regional equity.
2.Integrated Urban Planning: Develop an integrated urban development plan that considers the specific needs of each urban center. This plan should include provisions for health care, education, banking, and recreational facilities in smaller towns to enhance their functional importance.
3.Capacity Building for Local Governance: Strengthen the capacity of local governing bodies to manage and implement urban development initiatives effectively. This includes providing training and resources for urban planning and management.
4.Community Participation: Encourage community involvement in the planning process to ensure that the needs and preferences of local populations are considered. This can enhance the effectiveness and acceptance of development strategies.
5.Adoption of Technology: Utilize Geographic Information Systems (GIS) and other digital tools to monitor and manage the distribution of facilities. This can help identify gaps and optimize resource allocation in real-time.
